All posts by atascientific

Measuring Surface & Interfacial Tension

At a basic level, surface and interfacial tension have a lot of similarities. In their simplest form, they are both effects which are based on liquids. While we may observe these effects in everyday life in the shape of droplets or soap bubbles, interfacial tension and surface tension are two different phenomenons.

Surface tension is defined to a single liquid surface, whereas interfacial tension involves two liquids that don’t mix together. The differences don’t end there, though, as both surface and interfacial tension require different means to measure the tension appropriately and effectively.

What is Surface Tension

The phenomenon called surface tension is the property at the surface of a liquid that causes it to behave like a plastic sheet. Essentially, the cohesive forces between liquid molecules are responsible for what we know to be called surface tension. The molecules at the surface don’t have similar neighbouring atoms all around, so they cohere stronger to those directly associated with them on the surface.

How Surface Tension is Measured

A traditional measurement of surface tension is the du Noüy ring method.

However, surface tension can also be measured using the Wilhelmy plate method, which is a simple and accurate form of tensiometer. This type of measurement relies on the interaction between the platinum plate and the surface of the liquid.

In this method, the position of the probe relative to the surface is significant. As the surface comes into contact with the probe, the instrument will detect this by the change in force that it experiences. Subsequently, the height at which this occurs and zero depth of immersion is registered. The plate is then wetted to a set depth, and when it is returned to the zero depth of immersion the force is registered and used to calculate the surface tension.

Products like the Attension Theta Flex are used as an optical tensiometer to characterise surface properties.

What is Interfacial Tension

Interfacial tension can be described as the force that keeps the surface of one liquid from interfering with the surface of another liquid. It’s a measurement of the cohesive or excess energy present at an interface arising from an imbalance of forces. This happens when two different phases, like gas and liquid, come into contact with each other, resulting in the molecules at the interface experiencing a force imbalance.

This type of imbalance leads to a buildup of free energy at the interface. This excess energy is commonly referred to as surface free energy and can exist at any type of interface. However, if it exists at the interface of two immiscible liquids, the measurement is one of interfacial tension.

How Interfacial Tension is Measured

Interfacial measurements can be done through the optical tensiometer by pendant drop shape analysis. The shape of the drop hanging on the needle is determined by a balance of forces, which include the surface tension of the liquid. Then the interfacial tension can be related to the drop shape by the equation.

Interfacial tension can also be measured by a force tensiometer. This instrument measures the forces exerted on the probe which is positioned at the liquid/gas interface. The probe is connected to a sensitive balance and interested liquid interface is brought into contact with the probe. Subsequently, the force measured by the balance as the probe interacts with the surface of the liquid can be used to calculate the tension.

The Difference Between the Two

Both interfacial tension and surface tension are effects based on liquids. Additionally, both effects take place due to the unbalanced intermolecular forces between liquid or solutions molecules. However, while the location of the effects are the same, there are differences between the two.

Firstly, surface tension is defined as the force parallel to the surface, perpendicular to a unit length line drawn on the surface. Essentially, it relates to the property of the liquid in contact with gas phase. Comparatively, interfacial tension is defined only to immiscible liquids as it applies to the interface of the two liquids.

Due to the differences in where they occur, both surface tension and interfacial surface have means of measurement that suit each. Specifically, the Wilhelmy Plate is thought to work better with high surface tension liquids, whereas a rod or pendant drop method of measurement is more suitable for working out interfacial tension where the amount of liquid involved is limited.

Another difference is the vast impact of pressure and temperature on surface tension. Surface tension decreases almost quite linearly with temperature. Therefore, when the temperature increases, the molecular thermal activity increases causing the cohesive interaction to decrease. Pressure is another external factor that has an affect on surface tension.

How ATA Scientific Can Help You Determine Surface Tension

When determining surface tension, perhaps the best options are the du Noüy ring or Wilhelmy plate method, while optical or force tensiometres work best for interfacial tension measurements. For more information regarding surface and interfacial tension and measurement practices, contact us today at ATA Scientific.

3 Things to Consider when Purchasing a Quartz Crystal Microbalance

A quartz crystal microbalance or QCM measures a mass per unit area by measuring the change in frequency of a quartz crystal resonator. The sensor, which is the crystal, oscillates at a constant frequency and as the mass on the crystal changes, so does the resonance frequency. The addition or abstraction of the mass is due to oxide growth or film deposition at the surface of the acoustic resonator. The QCM works under vacuum, in gas and even in liquid environments. Under vacuum, it is useful for monitoring the rate of deposition in thin film deposition system and in liquid; it is effective at determining the affinity of molecules to surfaces functionalised with recognition sites. Simply put, QCM is the mass measurement standard, just as laser diffraction is essential for the measurement of particle size.

A basic QCM includes a source of alternating current — the oscillator, a quartz crystal, two metal electrodes on opposite sides of the thin crystal wafer and a frequency counter. According to most experts, choosing a QCM is a matter of finding the right match for the analytical objective and sample conditions. There are however, three important things that play critical roles in the equipment’s functionality that you should consider.

1. The Crystal

There are a few parameters that you have to determine when purchasing QCM crystals.

Frequency

Although higher frequencies will provide better resolution, these crystals will be more difficult to handle. A crystal’s frequency ranges from 1.00 to 30.000MHz.

Blank Diameter

The standard blank diameters are .538”, .340” and .318”.

Electrode Diameter

The electrode diameters available include aluminium, carbon, chromium, cobalt, copper, molybdenum, nickel, palladium, platinum, silicon, silver, tin oxide, titanium, tungsten, zinc.

Mounting and Bonding

While most crystals will be bonded to a base that provides a physical and electrical connection, you may request for the crystals to be un-bonded and coated with material from your facility.

2. Crystal Accessories

For a QCM crystal to work, you must have some type of oscillator circuit to enable a connection. In most cases, an enclosure or liquid/static cell for the crystal is necessary. There are two main types of high-quality oscillators specially designed for use with QCM crystals. They are standard (clock) oscillators used in gaseous applications and lever oscillators used in liquid applications.

3. QCM Components

In addition to the crystals, there are also a variety of components to complement the QCM. Some components are limited to manual control while others have different levels of electronic module. A QCM with the additional measurement of dissipation is called QCM-D. Dissipation provides information about the structure and viscoelasticity of the film. The measurement of particle size which can be done with a particle size analyzer and the study of surface properties are essential for a better understanding of the way in which materials interact, making the QCM-D very useful and effective as it is a real-time, label-free, surface-sensitive technique.

Microscopy

QCM-D can be combined with light microscopy using the window module. This visual entry allows correlation of real-time microscopy to changes in mass and viscoelastic properties. Studies of light-induced reactions and cell adhesion are also enabled.

Electrochemistry

As electrochemistry and QCM-D are surface techniques, they form an ideal pair. Electrochemistry can be the stimulus of an interaction or provide information about interfacial charge transfer while QCM-D can provide real-time information on mass and structure of these films. One such application is electrostatic interactions of biomolecules with surfaces.

Make an informed purchase

Do you need a Quartz Crystal Microbalance for your processes? ATA Scientific offers quality scientific instruments and can help you decide which instrument best fits your needs. Contact ATA Scientific today.

Looking for the perfect analytics instrument for YOUR next big discovery?

Speak with the ATA Scientific team today to get expert advice on the right instruments for your research

Request free consultation

14 Science Blogs Everyone Should Follow

With the advent of the Internet, science has never been so open to the public. Entire scientific communities now instantly connect through social media, and science blogs have prospered and grown into rich platforms of scientific discourse. On the Internet experts and amateurs alike can come together to talk about the topics that interest them, and in doing so have created great educational spaces for anyone wanting to learn and discuss everything and anything about science.

If you’re looking for some up-to-date scientific information, or just wanting to have a browse, have a look at this list we’ve compiled of the 14 best blogs currently posting about science and its related fields.

1. IFL Science

Established by Elise Andrews in 2012, I F***ing Love Science, or IFL Science, is ‘dedicated to bringing the amazing world of science straight to your newsfeed in an amusing and accessible way.’ With a reputation for being one of the most important and entertaining scientific blogs currently out there, Andrews has been able to create a platform that is equal parts informative and fun. Featuring insights into a mix of scientific disciplines, the best part about this blog is science lovers of all ages and backgrounds can come together and share their love for everything from quantum physics, to this double headed snake with a split personality.

Currently the Facebook page posting daily links to IFL Science has over 24 million likes.

2. CSIRO

The Commonwealth Scientific and Industrial Research Organisation (CSIRO) is Australia’s national science agency. Established in 1916, the CSIRO can be attributed with inventing everything from modern day WiFi, Aerogard, and even extended wear contact lenses. With such an innovative impact on both a national and global scale, it’s no surprise their blog is one of the most interesting scientific reads on the internet. Covering a vast number of topics including farming, ocean studies, manufacturing and health, the CSIRO is a fantastic insight into some of the most fascinating scientific breakthroughs by Australian and international scientists.

3. Dr Karl Kruszelnicki

Featuring Kruszelnicki’s trademark humorous yet informative approach to science, this blog delves into some of the most complicated and frequently asked (but not so frequently answered in an accessible way) scientific questions everyday people have. From the beautiful act of vomiting, to the overwhelming grand ‘how many cells in a person?’, Kruszelnicki seeks to entertain and educate in a laidback and educational manner that young and old Australians alike will love. For more of Dr Karl, you can also check out his Twitter, and tweet him any of your burning scientific questions.

4. Nautilus

Nautilus “combines the science, culture and philosophy into a single story told by the world’s leading thinkers and writers.” Originally a magazine and online website, the Nautilus blog is an offshoot that provides daily musings reflecting on our connection with science in our day-to-day lives. Science with a modern twist, this blog will appeal to those who are interested in questioning the humanity of science, and the scientists who drive innovation around the world. Don’t be mistaken in thinking this blog foregoes science in the name of philosophical musings – each of its pieces are thoroughly researched, and very accessible for those who enjoy a little bit of light science reading.

5. PLOS

The Public Library of Science is a non-profit organisation that provides a collection of scientific journals and literature open to the public. The PLOS blog network features content from PLOS staff and editors, as well as independent sources including science journalists and researchers. Blogs featured on the PLOS platform cover a wide range of topics like Biology Life Sciences, Medicine and Health, and Research Analysis and Scientific Policy. Catered towards the scientific community and those who have a thorough understanding of scientific concepts, this blog isn’t for everyone, but is a great tool if you are an avid science enthusiast looking to find free resources and information on many topics.

6. Improbable Research

Improbable Research is all about making people laugh…and then think. A collection of real research creators describe as “may be good or bad, important or trivial, valuable or worthless,” it’s an online manifestation of the popular Annals of Improbable Research, a publication mainly known for creating the Ig Nobel Awards, a parody of the Nobel Awards. A seriously fun look into the slightly crazy and often bewildering world of science, this blog is sure to captivate your curiosity and get you thinking about the value of scientific research and innovation.

For a great read, and to get an idea of the kind of material you’ll find on this blog, take some time to check out their recent article, ‘Why Bearcats Smell Like Popcorn’.

7. LAELAPS

One of seven blogs presented by National Geographic as part of the Phenomena series, LAELAPS is written by critically acclaimed scientific writer Brian Switek. A blog about evolution, extinction, and survival, LAELAP’s explores natural history with insights from fields such as anthropology, zoology, archaeology and palaeontology. If biological science is a keen area of interest, this blog has some great pieces of scientific literacy that bridge the gaps between complex concepts, and accessible and captivating stories.


Looking for the perfect analytics instrument for YOUR next big discovery?

Speak with the ATA Scientific team today to get expert advice on the right instruments for your research

Request free consultation

8. Annals of Botany Blog

News and views on plant science and ecology, the blog is an offshoot of Annals of Botany, an online scientific, peer-reviewed journal that releases research once a month. This blog really gets into the nitty gritty of plants, so its content is more suited to those who have a deep understanding and knowledge of botanical science. However, if you are wanting to delve right into the world of botany, it does post some content that is accessible for all science lovers.

9. No Place Like Home

Another blog from National Geographic’s Phenomena series, No Place Like Home is all about the cosmos. Written by scientific journalist Nadia Drake, this blog is “her space to talk about space – from other worlds to exploding stars to the fabric of the universe.” With space coming back to the forefront of the public consciousness with the help of figures like Chris Hadley and evidence that there is water on Mars, this blog is a refreshing look into a topic that has captivated minds for centuries. Entertaining and educational, her writing approaches some very big concepts and ideas with ease and simplicity. A must-read for anyone who loves everything and anything about space.

10. Neurologica

Authored by academic clinical neurologist Steven Novella, MD, Neurologica covers neuroscience, scientific scepticism, philosophy, and the intersection of science and media. This blog delivers a great insight into the brain and scientific news, issues and discoveries surrounding this topic, and is equal parts high-brow and approachable. Novella’s knowledge and expertise enable him to make some great thoughts, insights and opinions on a variety of subjects, from GMO’s to clickbait. A platform which broaches hot-topic issues found in mainstream media in a scientifically critical way, this really is a truly educational and eye-opening resource.

11. Aeitology

With a PhD in molecular epidemiology, Tara C Smith knows her diseases. Her blog Aeitology discusses the causes, origins, evolution and implications of disease, as well as other phenomena. While all that sounds like a bit of a mouthful, the blog gives an understandable, yet also intriguing discussion of modern day health and pathology. Dedicating posts to topics such as the Zika virus, antibiotic resistance, and quarantine, Smith discusses topics which are of public interest, and is a reliable source when it comes to understanding hot media topics concerned with disease.

In a recent post, she cleverly related the current public fascination with zombies to infectious diseases, making for a both educational and interesting read.

12. Mortui Vivos Docent (mrs_angemi)

WARNING: This blog is not for the faint of heart as it contains graphic material some may find disturbing (and others might find captivating). Mortui Vivos Docent is an Instagram blog run by forensic pathologist Nicole Angemi. Featuring graphic images of autopsies, Angemi captions each image with a scientific insight into the gruesome world of human biology. Her expertise lies in identifying infections and diseases in the deceased, and her lengthy captions break down some very complex medical concepts into easy to understand snippets. She also frequently asks followers to guess the disease from an autopsy, and will later post a detailed answer of her analysis.

13. Coding Horror

Created by software developer and entrepreneur Jeff Atwood, Coding Horror is one of the most well known blogs in the computer programming community. Atwood states in his About Me that, “in the art of software development, studying code isn’t enough; you have to study the people behind the software, too.” With this in mind, Coding Horror’s undertakes in-depth analysis of the minutiae of coding, and also of the people who created it. This two-pronged approach makes for a refreshing take on an otherwise technical topic. Perfect for both amateur and pro coder’s, this blog is an education in how to ‘geek out’, without losing your audience’s attention.

14. Climate Consensus – the 97%

Authored by John Abraham, a professor of thermal sciences, and environmental scientist Dana Nuccitell, this blog concentrates on climate and environmental science, and discusses the public scepticism surrounding popular environmental topics. A recent article entitled ‘It’s settled: 90-100 % of climate experts agree on human-caused global warming’, is an interesting insight into the power of ‘expert consensus’. A must-read for those with a keen passion for climate science, Climate Consensus’ articles are both accessible and thought provoking.

There’s no shortage of science online

A quick search in Google, and you can generally find whatever information you need. But sometimes the mass and diversity of material on the Internet can be overwhelming. Blogs are a valuable resource that can give analytical insights into the people, inventions and discoveries driving scientific innovation. Macro or micro, the blogs in this list engage in discussions and topics that will continue to evolve and change throughout history. Up-to-date and topical science blogs are the future for scientific research, education and outreach, a future which is being built by the blogs mentioned above.

Have we missed a really great science blog? Tell us where you get your daily science fix in the comments section below! Looking for more information about scientific instruments for your own scientific endeavours? Contact ATA Scientific today.

Protein Analysis Techniques Explained

Proteins Explained

Proteins, also known as polypeptides, are organic compounds made up of amino acids. They’re large, complex molecules that play many critical roles in the body.

Proteins are made up of hundreds of thousands of smaller units that are arranged in a linear chain and folded into a globular form. There are 20 different types of amino acids that can be combined to make a protein and the sequence of amino acids determines each protein’s unique 3-dimensional structure and its specific function.

Proteins do most of the work in cells and are required for the structure, function, and regulation of the body’s tissues and organs. Essential parts of organisms, they participate in virtually every process within cells. Many proteins are enzymes that catalyse biochemical reactions and are vital to metabolism. The size of a protein is an important physical characteristic and scientists often use particle size analysers in their studies to discuss protein size or molecular weight.

THE STRUCTURE OF PROTEINS

To be able to perform their biological function, proteins fold into one or more specific spatial conformations driven by a number of non-covalent interactions such as hydrogen bonding, ionic interactions, Van der Waals forces, and hydrophobic packing. This understanding is the topic of the scientific field of structural biology, which employs traditional techniques such as X-ray crystallography, NMR spectroscopy, and Circular Dichroism spectrometry to determine the structure of proteins.

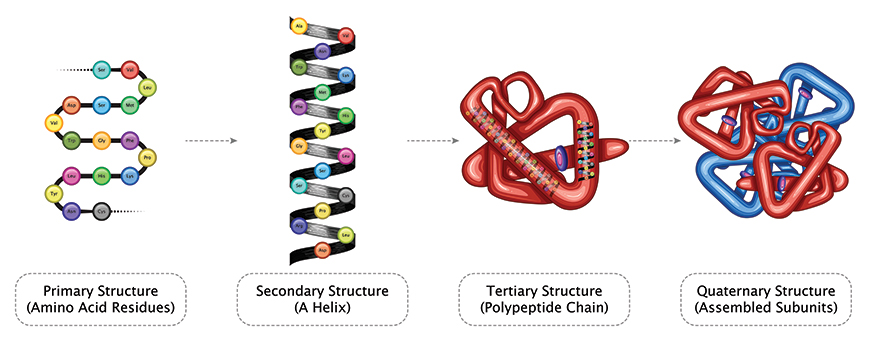
Most proteins fold into unique three-dimensional structures. The shape that a protein folds into naturally is known as its native conformation. While most proteins can fold unassisted through the chemical properties of their amino acids, others require the aid of molecular chaperones. There are four distinct aspects of a protein’s structure:

  • Primary structure: The amino acid sequence.
  • Secondary structure: Regularly repeating local structures stabilised by hydrogen bonds.
  • Tertiary structure: The overall shape of a single protein molecule; the spatial relationship of the secondary structures to one another.
  • Quaternary structure: The structure formed by several protein molecules which function as a single protein complex.

Protein structures range in size from tens to several thousand amino acids. By physical size, proteins are classified as nanoparticles, between 1 – 100nm. Very large aggregates can be formed from protein subunits. For example, many thousand actin molecules assemble into a microfilament.

TRADITIONAL PROTEIN ANALYSIS TECHNIQUES

Proteins differ from each other according to the type, number and sequence of amino acids that make up the polypeptide backbone. Hence, they have different molecular structures, nutritional attributes and physicochemical properties.

There are three major protein analysis techniques: protein separation, western blotting and protein identification.

1. PROTEIN SEPARATION

Protein electrophoresis is the process of separating or purifying proteins by placing them in a gel matrix and then observing protein mobility in the presence of an electrical field. It’s an important approach to studying protein function and the effect of a particular protein on development or a physical function by introducing it into an organism.

The most commonly used technique for protein separation is sodium dodecyl sulfate polyacrylamide gel electrophoresis (SDS-PAGE). Proteins can be separated according to solubility, size, charge and binding affinity. SDS-PAGE separates proteins mainly on the basis of molecular weight as opposed to charge or folding. It’s a technique that’s widely used in biochemistry, forensics, genetics and molecular biology.

Other methods include:

  • Isoelectric Focussing: In this method, different molecules are separated by their electric charge differences. This technique is a type of zone electrophoresis that is usually performed in a gel and takes advantage of the fact that a molecule’s charge changes with the pH of its surroundings.
  • Chromatic Methods: There are two chromatic methods frequently used for protein separation – high-performance liquid chromatography and thin-layer chromatography. Both these methods are particularly useful adjuncts to gel-based approaches. Although chromatography is a common technique in biochemistry laboratories used for purification, identification and quantification of protein mixtures, laser diffraction is traditionally used for pre-column size and polydispersity management.
  • Two-dimensional Gel Electrophoresis: This is a powerful gel-based method commonly used to analyse complex samples in the interest of characterising the full range of proteins in the sample, not just a few specific proteins.

2. WESTERN BLOTTING

The western blot technique uses three elements to identify specific proteins from a complex mixture of proteins extracted from cells: separation by size, transfer to a solid support, and marking target protein using a proper primary and secondary antibody to visualise.

The most common version of this method is immunoblotting. This technique is used to detect specific proteins in a given sample of tissue homogenate or extract. The sample of proteins is first electrophoresed by SDS-PAGE to separate the proteins based on molecular weight. The proteins are then transferred to a membrane where they are probed using antibodies specific to the target protein.

3. PROTEIN IDENTIFICATION

There are two methods that are commonly used to identify proteins: Edman Degradation and Mass Spectrometry.

Developed by Pehr Edman, Edman Degradation is a method of sequencing amino acids in a peptide. Here, the amino-terminal residue is labeled and cleaved from the peptide without disrupting the peptide bonds between other amino acid residues.

Protein Mass Spectrometry is an analytical technique that measures the mass-to-charge ratio of charged particles for determining masses of particles and the elemental composition of a sample of molecules as well as for elucidating the chemical structure of molecules such as peptides. Protein mass spectrometry is an important method for the accurate mass determination and characterisation of proteins, and a variety of methods and instrumentations have been developed for its many uses. The application of mass spectrometry to study proteins became popularised in the 1980s after the development of MALDI and ESI. These ionisation techniques have played a significant role in the identification of proteins. Identification can be made via:

  • Peptide mass fingerprinting uses the masses of proteolytic peptides as input to a search of a database of predicted masses that arise from digestion of a list of known proteins. The main advantage of this method is that it doesn’t depend on protein sequencing for protein identification. The limitation of this method is that it requires the database to have the protein which is already characterised on another organism.
  • De novo peptide sequencingis performed without prior knowledge of the amino acid sequence. This method can obtain the peptide sequences without a protein database and uses computational approaches to deduce the sequence of peptide directly from the experimental MS/MS spectra. It can be used for unsequenced organisms, antibodies, peptides with posttranslational modifications (PTMs) and endogenous peptides.

MODERN PROTEIN ANALYSIS TECHNIQUES

Protein complex analysis involves extensive interpretation of the structure and function of proteins, which are present in complex biological samples. Though recent protein complex analysis methods are efficient in identifying the structure of protein complex, there are some limiting factors.

The ever-increasing number of alternative ways to detect protein-protein interactions (PPIs) speaks volumes about the creativity of scientists in hunting for the optimal technique. Modern techniques are continually allowing us to study protein more effectively, efficiently and at reduced costs and include:

1. LIGHT SCATTERING

Light scattering techniques are particularly sensitive to larger molecules in preparations of smaller molecules. Any increase in the size of a protein will most likely be the result of aggregate formation. The sensitivity of the light scattering measurement to larger proteins means that the earliest stages of denaturation, leading to the formation of a few aggregates, will result in changes in the mean hydrodynamic size.

Batch Dynamic Light Scattering (DLS): Size measurement is the primary measurement of proteins that can be performed with batch-mode DLS. Since proteins have a very consistent composition and fold into tight structures, the hydrodynamic size relates predictably with molecular weight. The activity and function of a protein is closely related to correct folding and structure. As such, activity is also directly related to the size of the protein, meaning size can also be used as a predictor of activity. DLS the most sensitive technique for detecting small quantities of aggregates in preparations. Zetasizer software has a model to predict the molecular weight of a protein from its hydrodynamic size by DLS. Request a demo.

Static Light Scattering (SLS): Following on from DLS measurements, SLS measurements can also be made of proteins. Often highly purified, many protein samples should be applicable for batch measurements of molecular weight using SLS, as long as the concentrations are accurately known. By measuring the amount of light scattered at different concentrations of sample, the molecular weight, which is proportional to the amount of light scattered, can be calculated by creating a Debye plot. The slope of the line in the Debye plot is 2x the 2nd virial coefficient (a measure of molecular interaction within a solution) so this technique can also be useful for studying crystallisation conditions. A strongly positive value indicates good solubility while a strongly negative value indicates a propensity to aggregate. Request a demo.

Charge and Zeta Potential: Using a suitably sensitive instruments such as the Zetasizer Ultra, and an appropriate method such as the patented diffusion barrier technique, Zeta-potential measurements of proteins are also possible. A significant number of the functional groups on amino acids can be charged and any combination of these may be in their charged or uncharged states in the protein. This will change depending on the conditions in the local environment and it is important to note that zeta-potential can be different from the calculated net charge based on the likely state of the charged residues in the molecule.

Charge is of particular interest to protein chemists and Zeta potential should be able to compete with iso-electric focusing, currently one of the primary methods for determining protein charge, as it allows the protein to be kept in conditions far nearer to its native state. It should be noted, however, that proteins are subject to being denatured by the applied electric field, which can make zeta-potential measurements difficult. The diffusion barrier technique is a method that’s used to reliably measure the electrophoretic mobility of proteins by reducing the impact of the measurement process. For more information, contact us.

Overall, Zeta potential is a measure of the strength of the repulsive forces between molecules in solution. Conventionally, this has been used as a primary indicator of the stability of a sample preparation. With high Zeta potential, and consequently, high intermolecular repulsive force, a drug or protein preparation can be expected to be stable for longer periods than a similar preparation with low Zeta potential. Request a demo.

2. MULTI-DETECTION GPC/SEC

While DLS can be used to characterise the oligomeric state of a protein, it is unable to resolve a mixture of oligomers. Adding SEC capabilities to a light scattering detector is a way to greatly improve its resolution.

The Malvern OMNISEC Resolve and Reveal system separates molecules based on their size making it an excellent partner for light scattering. By separating the molecules before measuring them, using DLS or SLS, this technique can be used to identify the different components in a mixture. At known concentrations, measured with a refractive index or a UV detector, molecular weight can be related directly to the amount of light scattered by a molecule. This can be combined with data from a viscometer, which measures viscosity allowing size and some structural aspects to be determined. Thus, a large amount of information can be obtained for a single protein sample using this method.

The Malvern OMNISEC also adds another dimension to the detection of aggregates. By separating them from the primary sample, it’s possible to further characterise and quantify them. Manufacturers of protein solutions routinely use SEC as the final step in purification. SEC is used to separate samples in order to remove any aggregates formed in the sample preparation. The same is true when purifying a single protein from biological samples. Request a demo.

3. Circular Dichroism Spectrometry

Circular Dichroism (CD) is an absorption spectroscopy method based on the differential absorption of left and right circularly polarized light. Optically active chiral molecules will preferentially absorb one direction of the circularly polarized light. The difference in absorption of the left and right circularly polarized light can be measured and quantified. UV CD is used to determine aspects of protein secondary structure. Vibrational CD, IR CD, is used to study the structure of small organic molecules, proteins and DNA. UV/Vis CD investigates charge transfer transitions in metal-protein complexes.

JASCO J1000 series CD spectrometers provides maximum signal-to-noise under high absorbing, low light intensity conditions of the far-UV spectral region to explore the structure and stability of biomolecules. It provides unparalleled optical performance and versatile flexibility for advanced biomolecular characterisation and stereochemical analysis. The Dual Polarizing Prism Monochromator covers the entire region required for routine analysis of biomolecules with excellent stray-light rejection for accurate results. Enhanced vacuum UV measurement enables the measurement of a CD spectrum in the vacuum UV region can go down to 163nm which is of critical importance for biomolecules. Request a demo

4. Isothermal Titration Calorimetry

Isothermal titration calorimetry (ITC) is a physical technique used to determine the thermodynamic parameters of interactions in solution. It is most often used to study the binding of small molecules (such as medicinal compounds) to larger macromolecules (proteins, DNA etc.). It consists of two cells which are enclosed in an adiabatic jacket. The compounds to be studied are placed in the sample cell, while the other cell, the reference cell, is used as a control and contains the buffer in which the sample is dissolved.

The MicroCal PEAQ-ITC offers the highest sensitivity for label free measurements of binding affinity and thermodynamics with low sample consumption for the study of biomolecular interactions. It delivers direct measurement of all binding parameters in a single experiment and can analyze weak to high affinity binders, using as little as 10µg sample. Semi-automated maintenance minimizes operator intervention and the system is upgradable to the fully automated MicroCal PEAQ-ITC Automated, making it ideal for laboratories where speed, sensitivity and the ability to accommodate higher workloads in the future are paramount. Request a demo

PROTEIN ANALYSIS MADE EASY

Crystallisation of proteins is a necessary step for elucidating their detailed 3-dimensional structure. Crystallisation is a difficult process that requires a highly purified protein kept in ideal conditions. In DLS measurements, polydispersity is a measure of the purity of a sample. A protein sample with a very low polydispersity indicates that it is highly purified, that all the protein is in one particular oligomeric conformation and that its structure is very well controlled under these conditions, all of which are required for crystallisation. By identifying a protein sample with the lowest polydispersity, a researcher can find the most suitable conditions for crystallisation.

Size can also be used as a predictor of activity and quaternary structure of the protein can also be studied. When proteins oligomerise, their size and molecular weight will increase in discrete increments corresponding to the addition of separate proteins. By measuring the protein under different conditions the oligomeric state of the protein can be assessed. Many proteins rely on correct quaternary structure in order to function, so again, hydrodynamic size can be used as a predictor of activity.

In adverse conditions such as extremes of temperature and pH, a protein will become denatured. By controlling these conditions, and measuring the hydrodynamic radius, the melting point of the protein can be established. This is related to the stability of the protein and can be used as a predictor of shelf life.

Need the right tools for measurement? ATA Scientific offers a comprehensive toolbox for analysing proteins in a number of ways, including Multi detection GPC/SEC, Circular Dichroism (CD), Microcalorimetry (ITC/ DSC), Dynamic and Static light scattering (DLS/ SLS) and more. Contact us today for a free consultation and make protein analysis easy. We provide the instruments and ongoing support so that you can be confident in your results.

Methods of Surface Tension Measurement

Surface tension is defined as the attraction of molecules on a liquid’s surface. This is the tangential force acting at a liquid’s interface with air. The interface boundary is formed by the difference in attractions between liquids and gases. Surface tension is also sometimes called capillary force, surface energy, surface free energy or interfacial tension. Surface tension is measured in units. Water, the basal surface tension measurement, is defined as having a surface tension of 1.0.

The nature of surface tension is created by cohesion, the interaction of like molecules in this environment. Because the surface molecules are at the interface boundary, they act in relation to attraction with like molecules on the surface, not the adjoining gas molecules.

This creates the molecular relationship which typifies surface tension, a physical state which is different from the basic liquid state and the gases external to the liquid. A drop of water is a good example of surface tension in three dimensions, reflecting the drop’s relationship to the surrounding atmosphere. This force is highly cohesive. Even a raindrop, falling through the sky, retains a basic form.

Methods of surface tension measurement

It’s essential to note at this stage that measurement of surface tension is actually a measurement of forces. Surface tension has various properties, and the measurements are actually made of the state of balancing forces between for example water and air, which create the surface tension. The surface tension may be liquid to air, or liquid to solid, liquid to liquid, or in some cases combinations.

Water in a container, for instance, has two forms of surface tension- The surface interacting with air, and the surface interacting with the container. They’re different forces, created by different interactions. This is very important, because measurements relate directly to the behavior and properties of the whole liquid state.

(There’s also a relation between containing or surface interactive solids and the air around them. This is an extension of the surface tension measurement process often significant in chemistry and physics.)

Looking for the perfect analytics instrument for YOUR next big discovery?

Speak with the ATA Scientific team today to get expert advice on the right instruments for your research

Request free consultation

Modern vs traditional methods

Because of the different forms of surface tension, there are several methods of measuring it in terms of data applications.

The traditional measure of surface tension of liquids is the du Noüy ring method, (1925, Pierre Lecomte du Noüy) which is a mechanical process, using a measured force to lift a platinum ring from the surface of a liquid. The force required is the basis for measurement of surface tension of the liquid.

Modern methods of surface tension measurement are digital, like the Goniometer/ tensiometer method, which measures surface contact angle (this defines the exact interface surfaces) and capillary pressure between two static fluids, like water and air. This method measures pressure differences over the two fluids, and relates pressure to the shape of the surface.

Applications

There are many applications of surface tension measurement. Surface interactions are critical in analyzing the behavior of liquids. The relationship between the pressures involved in surface tension measurement is particularly relevant in defining their properties.

Make measuring easy

Measuring surface tension doesn’t have to be complicated. ATA Scientific offers a range of instruments suitable for measuring surface tension, so browse our product range today to find the right instrument for you.

ata - Scanning Electron Microscopes

The Applications and Practical Uses of Scanning Electron Microscopes

ata - Scanning Electron Microscopes

Scanning Electron Microscopes (SEMs) are used across a number of industrial, commercial, and research applications. From cutting edge fabrication processes to forensic applications, there’s a diverse range of practical applications for the modern SEM.

How SEMs work

A Scanning Electron Microscope (SEM) uses focused beams of electrons to render high resolution, three-dimensional images. These images provide information on:

  • topography
  • morphology
  • composition

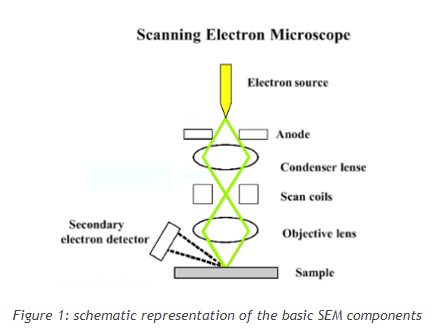
A schematic representation of an SEM is shown in Figure 1. Electrons are generated at the top of the column by the electron source. They are then accelerated down the column that is under vacuum, which helps to prevent any atoms and molecules present in the column from interacting with the electron beam and ensures good quality imaging.

Electromagnetic lenses are used to control the path of the electrons. The condenser defines the size of the electron beam (which defines the resolution), while the objective lens’ main role is the focusing of the beam onto the sample. Scanning coils are used to raster the beam onto the sample. In many cases, apertures are combined with the lenses in order to control the size of the beam.

Different types of electrons are emitted from samples upon interacting with the electron beam. A BackScattered Electron (BSE) detector is placed above the sample to help detect backscattered electrons. Images show contrast information between areas with different chemical compositions as heavier elements (high atomic number) will appear brighter. A Secondary Electron (SE) detector is placed at the side of the electron chamber, at an angle, in order to increase the efficiency of detecting secondary electrons which can provide more detailed surface information.

How is electron microscopy different to optical microscopy?

The key difference between electron and optical microscopy is right there in the name. SEMs use a beam of electrons rather than a beam of light. An electron source located at the top of the microscope emits a beam of highly concentrated electrons.

In SEMs, there are three different types of electron sources:

  • Thermionic filament – A Tungsten filament inside the microscope is heated until it emits electrons. A Tungsten filament operates at white-hot temperatures which means it gradually evaporates with time and eventually breaks which can contaminate the upper part of the electron column. The average lifetime of a Tungsten source is about 100 hours, depending on the vacuum.
  • Field emission gun (FEG) – Generate a strong electrical field that pulls electrons away from their atoms. This is typically the more popular choice in SEMs as it generates high resolution images, however it requires a vacuum design that often comes at a high price.
  • Cerium Hexaboride cathode (CeB6) – provides ten times the brightness compared to Tungsten which means a better signal-to-noise ratio and better resolution. A CeB6 source typically provides more than fifteen times the service life of Tungsten: 1500+ hours. A CeB6 source is used in all the desktop Phenom SEM series of instruments.


Looking for the perfect analytics instrument for YOUR next big discovery?

Speak with the ATA Scientific team today to get expert advice on the right instruments for your research

Request free consultation

Applications of SEMs

SEMs can be used in a variety of industrial, commercial, and research applications.

Materials science

SEMs are used in materials science for research, quality control and failure analysis.

In modern materials science, investigations into nanotubes and nanofibres, high temperature superconductors, mesoporous architectures and alloy strength, all rely heavily on the use of SEMs for research and investigation.

In fact, just about any material science industry, from aerospace and chemistry to electronics and energy usage, have only been made possible with the help of SEMs.

Nanowires for gas sensing

Researchers are exploring new ways nanowires can be used as gas sensors by improving existing fabrication methods and developing new ones. Electron microscopy is vitally important in helping characterise nanowires and understanding their gas sensing behaviour.

Semiconductor inspection

Reliable performance of semiconductors requires accurate topographical information. The high resolution three dimensional images produced by SEMs offers a speedy, accurate measurement of the composition of the semiconductor.

In fact, in just about all wafer manufacturing processes, SEMs are one of three essential quality control tools used. In the case of repetitive daily quality control tests, larger monitors (19 inches) have been shown to reduce visual fatigue for inspectors.

Microchip assembly

Microchip production is increasingly relying on SEMs to help gain insight into the effectiveness of new production and fabrication methods. With smaller and smaller scales and materials, as well as the potential of complex self assembling polymers, the high resolution, three-dimensional capacity of SEMs is invaluable to microchip design and production.

As the Internet of Things (IoT) becomes more prevalent in the day to day lives of consumers and manufacturers, SEMs will continue to play an important role in the design of low cost, low power chipsets for non-traditional computers and networked devices.

Forensic investigations

Criminal and other forensic investigations utilise SEMs to uncover evidence and gain further forensic insight. Uses include:

  • analysis of gunshot residue
  • jewellery examination
  • bullet marking comparison
  • handwriting and print analysis
  • examination of banknote authenticity.
  • paint particle and fibre analysis
  • filament bulb analysis in traffic incidents

Since SEMs offer the ability to examine a wide range of materials at high and low magnification without sacrificing depth of focus, their use in forensic sciences makes it possible to draw conclusions, identify material origins and contribute to a body of evidence in criminal and legal matters. The desktop Phenom GSR instrument is specifically designed for automated gun shot residue analysis.

Biological sciences

In biological sciences, SEMs can be used on anything from insects and animal tissue to bacteria and viruses. Uses include:

  • measuring the effect of climate change of species.
  • identifying new bacteria and virulent strains
  • vaccination testing
  • uncovering new species
  • work within the field of genetics

Soil and rock sampling

Geological sampling using a scanning electron microscope can determine weathering processes and morphology of the samples. Backscattered electron imaging can be used to identify compositional differences, while composition of elements can be provided by microanalysis. Valid uses include:

  • identification of tools and early human artefacts
  • soil quality measurement for farming and agriculture
  • dating historic ruins
  • forensic evidence is soil quality, toxins etc.

Medical science

Broadly speaking, SEMs are used in medical science to compare blood and tissue samples in determining the cause of illness and measuring the effects of treatments on patients (while contributing to the design of new treatments). Common uses include:

  • identifying diseases and viruses
  • testing new vaccinations and medicines
  • comparing tissue samples between patients in a control and test group
  • testing samples over the lifespan of a patient

Art

Not all SEM applications are strictly practical. Micrographs produced by SEMs have been used to create digital artworks. High resolution three dimensional images of various materials create a range of diverse landscapes, image subjects are both alien and familiar.

A practical and useful tool

Within the fields of industrial application and research, there is an increasing focus on quality control at microscopic scales. Achieving high resolution imagery with a scanning electron microscope can provide insight into many fields, making SEMs indispensable tools across many fields.

Need help finding the right electron microscope equipment for your application? Contact ATA Scientific today to for a free consultation and discover the right instruments for your project.

Uncovering the Relationship Between Genes and Proteins

What are Genes?

A gene is a basic unit of heredity in a living organism that normally resides in long strands of DNA called chromosomes. Genes are coded instructions that decide what the organism is like, how it behaves in its environment and how it survives. They hold the information to build and maintain an organism’s cells and pass genetic traits to offspring. A gene consists of a long combination of four different nucleotide bases namely adenine, cytosine, guanine and thymine. All living things depend on genes as they specify all proteins and functional RNA chains.

What are Proteins?

Proteins are large, complex molecules that play many critical roles in the body. They are necessary for building the structural components of the human body, such as muscles and organs. Proteins also determine how the organism looks, how well its body metabolises food or fights infection and sometimes even how it behaves. Proteins are chains of chemical building blocks called amino acids. A protein may contain a few amino acids or it could have several thousands. The size of a protein is an important physical characteristic that provides useful information including changes in conformation, aggregation state and denaturation. Protein scientists often use particle size analysers in their studies to discuss protein size or molecular weight.

Archibald Garrod

Archibald Garrod was one of the first scientists to propose that genes controlled the function of proteins. In 1902, he published his observations regarding patients whose urine turned black. This condition known as alkaptonuria happens when there is a buildup of the chemical homogentisate, which causes the darkening of urine. In most situations, excess amounts of amino acid phenylalanine are metabolised by the body. This led Garrod to surmise that the enzyme responsible for its breakdown must be defective in these patients. In addition, since the black urine phenotype was passed from generation to generation in a regular pattern, Garrod reasoned that a gene had to be responsible for the production of the defective enzyme. He attributed a defective enzyme to a defective gene, suggesting a direct link between genes and proteins.

The Relationship Between Genes and Proteins

Most genes contain the information require to make proteins. The journey from gene to protein is one that is complex and controlled within each cell and it consists of two major steps – transcription and translation. Together, these two steps are known as gene expression.

Transcription: Information stored in a gene’s DNA is transferred to a similar molecule called RNA in the cell nucleus. Although both DNA and RNA are made up of a chain of nucleotide bases, they have slightly different chemical properties. The type of RNA that contains the information needed to make protein is called a messenger RNA or mRNA and it carries the message from the DNA out of the nucleus into the cytoplasm.

Translation: This is the second step in the production of proteins and it takes place in the cytoplasm. The mRNA interacts with a specialised complex known as a ribosome that reads the sequence of the mRNA bases. Each sequence has three bases called a codon, which codes for one particular amino acid. A transfer RNA or tRNA assembles the protein, one amino acid at a time. This continues until the ribosome meets a “stop” codon. The characterisation of different proteins can be conducted by Size Exclusion Chromatography as this technique can be used characterise molecular weight, structure and aggregation state.

Learn more about genes and proteins

If you’re wanting to better understanding the relationship between genes and proteins, you’ll want the best equipment for the job. ATA Scientific provides quality scientific equipment for all your needs, so contact us today for a free consultation.

Looking for the perfect analytics instrument for YOUR next big discovery?

Speak with the ATA Scientific team today to get expert advice on the right instruments for your research

Request free consultation

Get Deeper Information from your Live Cell Assays using the new Livecyte

Livecyte Now Available!
Real-time analysis outputs, all-new incubator & advanced tracking
Livecyte is a leap forward in cell analysis

Label-free live cell imaging is allowing researchers to obtain a more accurate and realistic understanding of cell behaviour providing greater insights into cellular processes.

Automated Scratch-free Motility Measurements
Easily and repeatedly perform motility assays without the need to create a gap or wound.

Proliferation, Motility and Morphology
Save time, cells and reagents: Every Livecyte assay evaluates and displays multiple parameters in a single experiment.

Secret life of cells
Observe the unexpected phenotypical behaviour of cells and consider the implications of targeted therapies.

From 96 wells to Individual Cells
Explore population level behaviour AND characterise each cell in every well of a standard multi-well plate, all from a single experiment.

Metrics at the Touch of a Button
Compare a wide range of parameters to comprehensively profile cell behaviour with the built-in dashboards.

Learn more about our wide range of applications using Livecyte
Click here to visit the app note library

Visit us at these events to discuss your cell analysis and discover more.

BIOLOGICAL OPTICAL MICROSCOPY PLATFORM ANNUAL SYMPOSIUM 2019… 1 October 2019

JOHN CURTIN SCHOOL OF MEDICAL RESEARCH (JCSMR) TRADE DISPLAY EXPO… 25 October 2019

Light microscopy to electron microscopy: Latest techniques to gain more insights into materials research

Additive Manufacturing (AM), also known as 3D printing or rapid prototyping, is the process of building three dimensional structures or components from the ground up, usually layer by layer. Material characterisation requirements can differ depending on the techniques, equipment and materials used in AM. Using complementary techniques, such as advanced automated image analysis with Raman spectroscopy (Morphologi 4-ID) and high resolution Scanning Electron Microscopy with X-ray analysis (desktop Phenom SEM), allows manufacturers to identify and specify suitable metal powders, optimise AM processes and achieve consistently high quality parts.

JOIN US AT THE APICAM MEETING: June 30 to July 3, 2019

ATA Scientific is a silver sponsor at the Asia-Pacific International Conference on Additive Manufacturing (APICAM) conference to be held at RMIT University.  Visit our trade table to use the new desktop Phenom Pro X Scanning Electron Microscope (SEM) with integrated EDS for element identification.

Attend our talk: Wed 3 July @ 8:50am.  Presented by Dr David Myint
Powder to product: tools for quantitative characterisations of starting materials and finished products in 3D printing

Watch this video 
Phenom XL desktop SEM: quantify the morphology, chemical composition and particle size distribution of metal powders.

Download this E-guide
Provides guidance to assists you in choosing the most suitable SEM for better and faster materials analysis.

Watch this demonstration video
Measure metal powders for AM and powder metallurgy applications using the Morphologi 4 automated imaging platform.

Download this free white paper
Optimising metal powders for AM – explore the impact of particle size, shape, flowability & bulk density.

ATA SCIENTIFIC ENCOURAGEMENT AWARD – JUNE WINNERS POSTED

Congratulations to our winners.

  • $1500 first prize: Stefan Mueller, University of Wollongong.
  • $600 runner up: Nikolai Macnee,  University of Auckland.
  • $600 runner up: Lakshanie Wickramasinghe, Monash University.

The ATA Scientific Encouragement Award aims to provide young scientists with financial assistance to further their education and attend scientific meetings and conferences. First prize is for $1500 and there are two runner up awards at $600 each.

VIEW CURRENT AWARD HERE

Go Beyond Traditional Microscopy: How To Use Label-Free Techniques for Live Cell Imaging

Live Cell Imaging is a major area of growth in the microscopy world as researchers search for techniques to elucidate further mysteries of the human body. Traditional microscopy systems often fail to automatically identify individual cells due to lack of contrast and while labelled techniques can produce high contrast images, they ultimately perturb the cells and can be phototoxic. This can ultimately limit the type of cell that can be used and the duration that they can be imaged before measurement-induced cell behaviour changes emerge.

Given these challenges, the search for a panacea can be futile as an ever-increasing number of technologies refine previous versions, all of which have a valid use and solve a question.

The process of defining the desired outcome of an experiment can be clouded by the latest and greatest shiny new toy that is a ‘must have’ for any self-respecting imaging facility. Is it 2D or 3D? Can we do spheroids? What about angiogenesis, Matrigel, bespoke slides, polylysine, fibronectin, or even hydrogel matrices? Do I need super-res, and what about a new confocal? Do we all still fluoresce – how many Photons?

Clearly, it’s a minefield of instrumentation – but what about applications of your science?

We’re in a position to discuss some interesting solutions to application needs.

Let’s put the quest to dive deep into cellular activities to one side, and let’s consider how cells interact with each other in a natural state. Have you ever thought about how cells react to fluorescent probes? Do they alter how the cells interact with each other? What about intense light? High light intensity does not bode well for the humble cell, are you perturbing the cells?
Population studies are normally the realm of cytometry, not the microscopist’s bread and butter.
Perhaps a system that allows both population and individual analysis would be of value, helping to understand kinetic data about your cells such as speed, displacement, Euclidean distance, meandering index and directionality associated with your treatments. Do you wish to track them? Understand their lineage? You could then re-culture the cells without any reservation or take them for testing elsewhere. Phasefocus in Sheffield, UK, have developed the Livecyte that employs a different modality in imaging called Ptychography – this method suits Live Cell Imaging with its 650nm <1mW laser that delivers incredibly low light toxicity. The instrument creates a diffraction pattern and stacks these patterns to run through the ptychographic algorithm, resulting in images that emulate the resolution of fluorescently tagged cells, ultimately allowing for excellent segmentation and tracking. They also have thought of the needs of scientists grappling with all this data. Whilst it is open for external analysis programs such as Image J, Cell Profiler and Metlab, the Livecyte has some incredible dashboards built into the software designed for popular applications such as Mitotic Time, Wound Healing, Angiogenesis, Proliferation and Morphology.

Ok, shall we dive into these cells now? Consider you have viewed the subtle interactions in your cells, identified some interesting behaviours on the Livecyte and now you would like to put these cells through a confocal microscope for depth selectivity, optical sectioning or to create 3D images. Damn – it is tied up for the next month! Maybe we should consider a benchtop confocal! Let’s make it simple and Laser free! Now, this is interesting if you are averse to long term costs of ownership – have you ever added up what you spend on all the confocal microscope maintenance? Aurox in Oxford, UK, has added a new system to their already successful “Bolt-On” Clarity range of confocal Microscopes with the soon to launch Unity. This super small, sit on the lab bench system has the hallmarks of a winning combination of ease of use (yes finally a confocal without the need of a flight licence to operate it) and powerful imagery. The spinning disk method they have patented is elegant and fundamentally simple. Normally the pinhole arrangement of a spinning disk allows for around 1% of light to be utilised, hence the need for high power lasers. Aurox has developed a novel optical arrangement that uses over 50% of the Cool LED light. Images are produced at a very rapid rate – say 150 images in 11 seconds – without the photobleaching evident in high intensity lasered systems and no need for laser safety restrictions. Often, it is difficult to obtain both high resolution and widefield images, let alone the ultra-large field of view – full overview images of the sample/mount can be detected with the sCMOS detector in the Aurox.

In keeping with the need to make it easy, the instrument is operated with a large format tablet over a secure wireless network with no more messy cables. They have a software called Visionary – a truly simple to use, easy to access web browser with a network connection that enables z -stack, time-lapse and multichannel imaging with OME-TIFF formats.

As instrument manufacturers increase the production of technology, generally they create efficiencies in manufacturing and the economies of scale kick in. As a result, one usually experiences a price drop in subsequent iterations of the model, and additional R&D costs are absorbed by higher sales volumes. This might be a common occurrence, but is not always the case…

I have noted a rise in the cost of a relatively simple technology employing basic fluorescence as its method of choice to perform live cell imaging inside an incubator. I doubt this rise is a result of additional functionality due to component pricing – not all systems need to be action packed with all capabilities to suit a broad range of users. People have also communicated to me their abhorrence that such an expensive system be locked away into individual researchers’ incubator. Clearly, there are always exceptions to the rule – and at times the application may warrant it. I think we have found a solid alternative at a fraction of the price with an impressive imaging system to boot.

Logos Biosystems in Seoul, South Korea, have developed the Celena-S and Celena-X – an on the bench High Content Imaging system. It is a nice little system, being fully automated, multi-channel, and having Multi-Well and Multi-position analysis – All on your bench – with a stage top incubator! The tech is more than sufficient for the applications it is used for, and the images are exceptional with lightning fast laser autofocus.
What I like the most about the Celena – X is the speed and quality of the images, particularly for this price. I guess the proof is in the pudding with this one – I suggest a demo.

Looking for the perfect analytics instrument for YOUR next big discovery?

Speak with the ATA Scientific team today to get expert advice on the right instruments for your research

Request free consultation