All posts by atascientific

NEW Phenom Pharos Desktop SEM with FEG source: Faster, brighter, crisper images

The new Phenom Pharos desktop scanning electron microscope (SEM) is the latest addition to the Phenom Series and is the first desktop SEM solution that includes a field emission gun (FEG).  This easy to operate system integrates both advanced hardware design and an intuitive user interface to provide high-resolution images in less than 25 seconds after inserting the sample. Suitable for a wide range of academic and industrial applications, the Phenom Pharos brings the high-resolution capabilities of a field emission source to a desktop model.

Phenom Pharos Specifications:
Source:  Field Emissions Gun (FEG)
Maximum magnification = 1,000,000 X
Resolution = < 3nm
Acceleration Voltage range = 2kV – 15kV
Imaging detectors:  Backscattered Electron Detector (BSD) + Secondary Electron Detector (SED)
Analysis (optional):  Integrated EDS detector
Vacuum observation modes:  High, Medium & Low vacuum

Contact us for a quote today!

The Phenom Pharos SEM will be available for use during two events listed below:

JOIN US AT THE IMC19 MEETING: 9-14 SEPT 2018
The International Microscopy Congress meeting will be held in Sydney at the new International Convention Centre. Visit us at the Thermo Fisher Scientific booth and use the new Phenom Pharos SEM with FEG source.

FREE WORKSHOP AT WESTERN SYDNEY UNI (Parramatta): 19 & 20 SEPT 2018.
Join us and use the Phenom Pharos Desktop SEM. Following each demonstration, the Phenom series of instruments will be available for participants to operate and for sample analysis. Please register by completing the registration form here.

Looking for the perfect analytics instrument for YOUR next big discovery?

Speak with the ATA Scientific team today to get expert advice on the right instruments for your research

Request free consultation

ATA Scientific - Gunshot Residue Analysis (2)

How Technology is Helping Forensics in Gunshot Residue Analysis

Within forensics, one technological innovation that has had a major contribution in ensuring the precision and accuracy of investigations is the automated analysis of gunshot residue (GSR).

Guns use a characteristic composition of lead, antimony, and barium, and have a discriminative spheroidal morphology. As a result of this, it’s quite obvious when a gun has been discharged, and the residue it leaves behind is relatively easy to reliably track.

GSR is not new, with highly qualified technical guides to using GSR detection in investigations existing since as far back as 1977. But what has changed in the years since has been the sharp improvement in detection processes, as well as the technology used to help facilitate those processes.

One example is particle analysis by scanning electron microscopy (SEM). SEM, alongside energy dispersive x-ray spectrometry (EDS), has become the default technology for use in analysis. This is because both technologies are precise in their measurements and allow investigators to conduct analysis without requiring the use of chemicals – in other words, the investigation technique is non-destructive when using SEM.

Making the most of GSR in investigations

It’s important to understand that GSR isn’t foolproof and a couple of factors can compromise its value as evidence. Most critical of these is that it’s easy to remove GSR following the firing of a weapon.

GSR occurs when, after being fired, the gun creates a cloud of particles that settle on the hand and nearby clothing. Unfortunately for investigators it’s very easy to remove GSR, as simply putting a hand in a pocket can rub a lot of it off, and washing hands or clothes will certainly remove the particles.

Another challenge is that GSR isn’t definitive proof that a person had fired a weapon. GSR can spread and settle on people located nearby, so while it’s not a naturally-occurring collection of particles, it’s still possible that a person who has never handled a gun could test positive if they were in the vicinity of a gun being fired.

These challenges involved in GSR analysis mean that the SEM equipment used in analysis need a couple of critical features.

What advanced SEM technology looks like

One example of a technology that is specifically designed to meet the challenges of GSM analysis is the Phenom GSR Desktop Scanning Electron Microscope. This technology has the following features:

Speed and automation

As GSR samples can be fragile and the particles brushed off quickly, it’s important that the scanning and analysis is done quickly. The Phenom GSR Microscope can create an electron image in less than 60 seconds after the sample is loaded. Additionally, because the hardware also has a software solution (ASTM E1588 compliant) built in, it’s possible to perform automated analysis and classification of samples to further speed up results.

Low maintenance

Because GSM analysis is so common in investigations, the technology used for analysis needs to be robust and reliable. The Phenom GSR Microscope has a high brightness thermionic source that offers a stable operational lifetime of greater than 1,500 hours.

Substantial magnification

It is, of course, critical that investigators can achieve maximum magnification on samples in an SEM test. The Phenom GSR Microscope can achieve magnifications of up to 100,000x.

What else does SEM do?

SEM analysis remains a critical component in forensic investigations. Not only can it give investigators a clearer picture of who’s likely to be the one that discharged a gun, but this analytical technique is also useful in painting a clearer picture of a scene. For example, the dispersion of particles, while not uniform, can give an investigator an idea of how far away a sample was from a gun being fired.

This can be broken down into three main categories:

  1. Contact (0-1cm from firing source)
  2. Close distance (1-50cm from firing source)
  3. Distant shot (50cm-100cm from firing source).

This information can be critical in understanding the relative position of individuals to the firing of a gun, and their facing relative to the person firing the gun (since the particles will settle in a direct line from the discharged firearm).

Phenom SEM technology for your lab

Gunshot Residue (GSR) analysis plays an important role in the determination if a firearm has been used in a crime. Forensic labs around the world are using the desktop Phenom GSR SEM to quickly scan samples and automatically find suspect GSR particles. If a suspect particle is found, the fully integrated Energy Dispersive X-Ray Spectrometer (EDS) is used to identify the elements in that particle.

For more information on how the technology works, or to arrange a demonstration, contact the ATA Scientific team.

Looking for the perfect analytics instrument for YOUR next big discovery?

Speak with the ATA Scientific team today to get expert advice on the right instruments for your research

Request free consultation

ATA Scientific - Particle Morphology

The Role of Particle Morphology in the Pharmaceutical Industry

There are several particle characteristics that are of critical importance when considering pharmaceutical properties. One of these is particle size (granulometry), and the other, perhaps less immediately obvious, is the morphology – the particle’s shape.

When it comes to all technical properties by which powders are measured (bulk density, flowability, surface areas etc.), the combination of granulometry and morphology are the key determinants that a chemist needs to consider when developing a product.

Understanding the role of particle morphology

The role of particle morphology for any given application will vary significantly. For example, if the purpose of the powder was to create high flowability or be in an optimal condition for particle melting and spraying, researchers will want to establish spherical particle shapes. On the other hand, if the goal is to create something abrasive, particles need to have high angularity in shape.

Pharmaceutical powder technology is extremely complex because the preparation, creation, and managing of the process has to be precise and create accurate results. The technology used needs to be able to deal with examining all the materials, formulations, additives, and processes. This ensures consistency and delivers exact results in the properties and performance of the particles.

Benefits of powdered drugs

One advantage of powdered drugs is that they can be delivered directly to the lungs (using an inhaler). This, of course, has been the traditional approach for asthma patients and other patients in need of pulmonary drugs. However, there’s a growing awareness that inhalation can be the preferable option because it offers such a rapid onset of action.

Indeed, the pulmonary option is commonly seen as a more convenient and less intrusive alternative. It’s the same for doctors and medical facilities because there is a reduced need to supervise drug delivery and no need to sterilise drug delivery products (reducing costs). It’s also worth noting that pulmonary administration means smaller doses in each intake and the potential side effects could be minimised.

The challenges of powdered drugs

One challenge that researchers and manufacturers face when working with powders is that they often fail to discharge reliably from bins, hoppers or silos. Powders also often have poor quality or unreliable flow in feeders and dosing machines. This means the manufacturing process can be regularly interrupted to the point of complete shutdowns in order to correct flow restrictions and stoppages.

When researching drugs for pulmonary droplet delivery, particle size and shape are critical. Particles that arelarger than five microns will not go deep into the lungs, and those that are too small – smaller than one micron – may be exhaled. Additionally, as we’ve discussed above, the efficiency in which a particle can be absorbed relies heavily on its morphology.

Popular methods of reducing particle size

Micronization

The most common process for reducing size is simple and well established – micronization. Micronization makes use of jet mills, does not use solvents, and can be used for thermally sensitive materials.

Solution or spray drying

Particles with amorphous regions that might crystallise over time or particles that are difficult to disperse over time because of electrostatic charges are a few examples of when micronization would not be effective. Alternative processes might include engineering particles by drying them from a solution or spray drying. This is an effective way of creating particles of a specific density and size.

Wet-polishing

Wet-polishing combines size-reduction technologies with isolation approaches and co-crystallisation is used to create particles of whatever required size while also incorporating excipients.

Other methods also include supercritical-fluid (SCF) antisolvent processing and co-crystallisation (a more novel process).

Particle imaging technology is providing the most accurate measurements

TheMalvern Morphologi 4 is an example of technology custom designed to accurately and measure the characteristics of particles. As a fully automated way to measure particle size, shape, count and its application for pulmonary administration, this device is an ideal way to develop a full understanding of the characteristics of a particle.

This technology is able to measure particle sizes from 0.5µm to >1300µm, and size parameters including circle equivalent diameter, length, width, perimeter, area, max distance, sphere equivalent vol, fibre total length and fibre width. The Malvern Morphologi 4 has a wide range of applicationssuch as automation of manual microscopy methods and the ability to detect foreign particulates in pharmaceutical dry powders, liquids and creams.

The Morphologi 4-ID adds further capabilities by delivering Morphologically-Directed Raman Spectroscopy (MDRS). The MDRS technique integrates the static imaging capabilities of the Morphologi 4 with Raman spectroscopy to enable the component-specific morphological characterisation of different chemical species in a mixture. Chemical identification of specific particles within a multi-component mixture can be useful particularly for identifying contaminants and for the rapid development of generic pharmaceutical formulations.

For more information on what the Malvern Morphologi 4 and Morphologi 4-ID can do in helping to measure and refine powders, please contact us today at ATA Scientific.

Looking for the perfect analytics instrument for YOUR next big discovery?

Speak with the ATA Scientific team today to get expert advice on the right instruments for your research

Request free consultation
Multi Angle DLS

New Malvern Zetasizer Pro and Ultra has arrived

Achieve high resolution analysis using Multi-Angle DLS 

Malvern Zetasizer Pro and Ultra systems deliver enhanced speed and ease-of-use for the measurement of particle and molecular size, particle charge and particle concentration.

Built on the market-leading Zetasizer Nano range, the new Zetasizer Ultra offers patented Multi-Angle Dynamic Light Scattering (MADLS®) technology, which automates multiple-angle size measurements, providing higher resolution and more complete particle size distributions. MADLS also enables calibration-free particle concentration analysis for a wide range of materials, resolving the individual concentrations of different size populations. The new disposable capillary sizing cell provides non-destructive, low volume (3μl) analysis, extending the upper range to 10μm and delivering high-quality data while reducing cost.

The Zetasizer Pro and Ultra systems are controlled by groundbreaking ZS Xplorer software, introducing new sample-centric workflows, which make method design and data analysis more straightforward for both new and experienced users.

Watch launch      Request a quote       Book a demo

ATA SCIENTIFIC AWARD – WINNERS POSTED
Congratulations to all our winners. The ATA Scientific Encouragement Award aims to provide young scientists with financial assistance to further their education and attend scientific meetings and conferences. First prize is for $1500 and there are two runner up awards at $600 each.
Like us on Facebook to be informed of the next award.

Looking for the perfect analytics instrument for YOUR next big discovery?

Speak with the ATA Scientific team today to get expert advice on the right instruments for your research

Request free consultation
Scanning Calorimetry Processes and Technology

A Short Guide to Differential Scanning Calorimetry Processes and Technology

Differential Scanning Calorimetry (known as DSC) defined simply, is a way of measuring and assessing heat energy intake, commonly in studies with polymers, liquid crystals, drugs and general chemical analysis.

It’s an enormously effective and useful technique that has a wide range of applications in a large number of fields. Here, we will explain how it works, where it’s used, and what features to look out for.

How does DSC work?

DSC is a technique used to study biochemical reactions as a molecule transitions from one conformation to another (the easiest and most obvious example of which is a sample’s melting point). There are two approaches including heat-flux and power-compensated DSCs.

Heat-flux DSC

The heat-flux DSC operates by leveraging two separate enclosed “pans.” One pan has the sample material and is placed on a thermoelectric disc that has been surrounded by a furnace. It’s important that the furnace is brought up – in terms of heat – at a consistent rate as it transfers heat through the pan to the sample.

The other pan is kept empty but is heated by the same furnace. There will be a difference in the temperatures of the two pans, as a result of the heat capacity of the sample. And from there, by leveraging the thermal equivalent of Ohm’s law (q=ΔT/R), it is possible to determine the heat flow.

Power-compensated DSC

This test requires the use of two separate pans as well as two separate heaters. Again, one will have the sample, and the other will not. By maintaining both pans at the same temperature, there will be a difference in the thermal power required – owing to the sample in one – and researchers can measure and plot that difference as a function of both temperature and time.

The application and value of DSC for researchers

So, what is DSC used for, and how is this technique valuable to researchers?

Using DSC technology for Biology

In biology, the formation of unique structures of macromolecules (proteins being one example) is known to be reversible, and these reactions are thermodynamically driven. DSC as a technique can be used to evaluate the factors that play a role in protein stability.

The use of heat also helps researchers observe fusion and crystallisation events, measure glass transition temperatures, and study chemical reactions such as oxidation. As temperatures rise, the molecules within the amorphous (or non-crystalline solid) will gain enough freedom to arrange themselves into a crystalline form. There’s a great deal of value to researchers in being able to measure this crystallisation temperature.

The pharmaceutical approach in using DSC

Another common and useful application of DSC is in drug analysis and discovery. Widely used in pharmaceutical industries, the DSC technique allows a researcher to study curing processes, and research the cross-linking of polymer molecules. In pharmaceuticals, it’s important that the components of a drug are precise, especially for the many drugs which require delivery in amorphous form. In order to ensure that, it’s important that the drug company is informed of the temperature in which crystallisation would occur. That way, they can keep their manufacturing and processing facilities optimised and operating below that temperature.

Other benefits of DSC to medical research is that the technology can be used to detect and eliminate component candidates that are more likely to bring stability issues to the drug.

What are the important technical features needed for DSC?

The technology required for DSC is, of course, highly specialised, and there are a number of critical features that you’ll need in order to maximise the value of the technology.

Sensitivity

Firstly, and perhaps most obviously, DSC technology needs to be highly sensitive. The lower the active cell volume, the better for researchers, because they’re often working with a very limited number of precious samples.

Speed and automation

The speed in which you can work with the machine is also of critical importance. And, the more the process is automated, the better. A high quality machine will handle all the filling, injection, and all cleaning functions to facilitate “walk-away” operation, and a good machine should handle dozens of samples per day.

Finding a quality DSC product

The MicroCal PEAQ-DSC Automated is a good example of the kind of advanced technology that really benefits researchers. It can measure very tight binding constants, (up to 1020M-1) and

can screen up to 50 samples per day, with a sample capacity of 288 (6 × 96-well plates), and full 24 hour unattended throughput. The MicroCal PEAQ-DSC Automated is the kind of automated technology that allows researchers to focus on more advanced tasks while providing comprehensive and exacting data.

Additionally – and this is important for DSC – molecules can be studied in their native state without labelling using the MicroCal PEAQ-DSC Automated. Solutions that interfere with optical measurements, such as particulate or coloured samples, can still be measured with highest accuracy.

For more information on the MicroCal PEAQ-DSC Automated, and how this fully integrated platform can help you or your researchers in delivering high quality results from biology to nanoscience, contact us at ATA Scientific.

Looking for the perfect analytics instrument for YOUR next big discovery?

Speak with the ATA Scientific team today to get expert advice on the right instruments for your research

Request free consultation

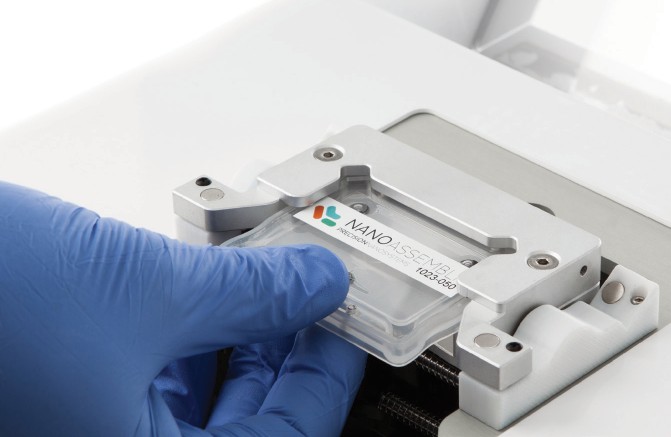
Discover the latest in Microfluidic Mixing for rapid, reproducible and scalable manufacture of novel nanoparticles.

Heading to the 9th International Nanomedicine Conference – 25-27 June 2018?
ATA Scientific is the Principle Sponsor

Drop by our stand and see the new NanoAssemblr
• Mixing is Laminar flow not turbulent. Predictable, repeatable.
• The system is completely Scalable! From research to manufacturing – seamlessly! Millilitres to Litres!
• Particle Size is Tuneable – Repeatable. Size is dictated by the constituents not the process!
Liposomes may be formulated with a wide variety of natural, synthetic, and modified lipid species, as well as drugs and contrast agents.

Contact us for more information

Watch this recording
Dr Peter Johnson (PNI) describes lipid nanoparticles for nucleic acid delivery in neuroscience research.

Watch this video
and see some of the latest research on mRNA vaccines and immuno-oncology therapeutics.

Watch this video
Learn how easy it is to use the NanoAssemblr Instrument for the rapid manufacture of nanoparticles.

ATA SCIENTIFIC AWARD – WINNERS POSTED
Congratulations to all our winners. The ATA Scientific Encouragement Award aims to provide young scientists with financial assistance to further their education and attend scientific meetings and conferences. First prize is for $1500 and there are two runner up awards at $600 each.
Like us on Facebook to be informed of the next award.

Looking for the perfect analytics instrument for YOUR next big discovery?

Speak with the ATA Scientific team today to get expert advice on the right instruments for your research

Request free consultation
Dynamic light scattering

New Zetasizer Pro and Zetasizer Ultra – Live launch 23 May 2018

On May 23rd, 2018, Malvern Panalytical will be unveiling the brand-new Zetasizer Pro and Zetasizer Ultra – two flagship systems which deliver the ultimate in particle and molecule size and zeta potential analysis.

Please join us for the live launch of the Zetasizer Pro and Ultra and see how the world’s best light scattering systems just got better. Let Malvern Panalytical introduce you to the future of light scattering.

Looking for the perfect analytics instrument for YOUR next big discovery?

Speak with the ATA Scientific team today to get expert advice on the right instruments for your research

Request free consultation

How does your phase imaging measure up?

Many phase contrast imaging and analysis techniques claim to be quantitative, but may use indirect or proxy measurements to define and quantify cells.

Quantitative Phase Imaging (QPI) generates high contrast, high quality images from which direct measures of morphology and motility can be extracted, allowing comprehensive analysis at both population and individual cell level.

Achieve a greater level of scrutiny with QPI

QPI
Quantitative Analysis
• High resolution imaging defines EVERY cell to give a true measure of cell count.

• DIRECT measurement of cell metrics. Suitable for heterogeneous populations where smaller sub populations can be differentiated.

• Computational technique. Calculates the extent of phase shift allowing thickness dependent measures to be determined for each cell
e.g. cell volume, dry cell mass and sphericity.

Phase Contrast
Quantitative Analysis
• Insufficient resolution to define each cell. Confluence used to ESTIMATE cell count.

• Analysis based on INDIRECT population level metrics, i.e.confluency, which characterises the cell population as homogeneous.

• Optical technique.
Unable to assess the extent of phase shift so individual cell parameters cannot be determined.

QPI – made to measure imaging
Is your phase imaging technique truly quantitative?
Compare the differences in outcomes between QPI and Phase Contrast imaging

Watch the short video to see how QPI metrics can enhance your data analysis

“Characterising live cell behaviour: Traditional label-free and quantitative phase imaging approaches”.

Click here for your copy of the recent paper

ATA SCIENTIFIC ENCOURAGEMENT AWARD – WIN $1500
The ATA Scientific Encouragement Award aims to provide young scientists with financial assistance to further their education and attend scientific meetings and conferences.

Simply outline in 500 words or less your answer to the question on our website. The participant who submits the most amusing or imaginative entry will receive the A$1500 award. There are also two runner up awards of $600 each.

Competition closing date 30 April 2018. Conditions apply.

Click here to enter our award

Looking for the perfect analytics instrument for YOUR next big discovery?

Speak with the ATA Scientific team today to get expert advice on the right instruments for your research

Request free consultation

Gabrielle McClymont University of Sydney

Encouragement Award winners April 2018

ATA Scientific would like to thank all those that participated in our April 2018 Encouragement Award promotion.

The topic of our latest competition focused on the future of scientific conferences and secondments and whether they are still needed with access to publications and information now fast and cheap over the internet. While presenting at scientific conferences can be an enjoyable and rewarding experience, the question invited readers to consider whether the money spent on these events could be better used on underfunded projects. The dilemma of attending scientific conferences or not can be intensified with the prospect of travelling to exotic locations or meeting famous Nobel Laureates. Overall, it came to no surprise that the social aspect and collaborative, scientific interaction that results from attending these events resonated with many for their support.

We were pleased to receive such a diverse range of high quality responses, all of which were deserving winners. Each entry was scored based on originality, relevance and level of entertainment.

OUR WINNERS

After much deliberation, three entries were selected to receive our award– first prize at $1500 and 2 runners up at $600 each.

Congratulations to our first prize winner Gabrielle McClymont, Masters student at the School of Life and Environmental Sciences, University of Sydney and works under the supervision of Professor Jacqui Matthews.

Gabrielle is researching novel α-helical peptide inhibitors of breast cancer oncogene LMO4. She has been working to redesign the peptide protein interface of LMO4 by replacing the traditional β-strand binding partners with novel inhibitory α-helical ones and designing a high throughput screening mechanism to identify these peptides.  Inhibitors of LMO4 are a method to understand LMO4 mediated tumour progression and possible therapeutic precursors.

Gabrielle plans to use the award money to help cover the costs of undertaking her PhD at Cambridge and in particular to attend conferences in Europe.

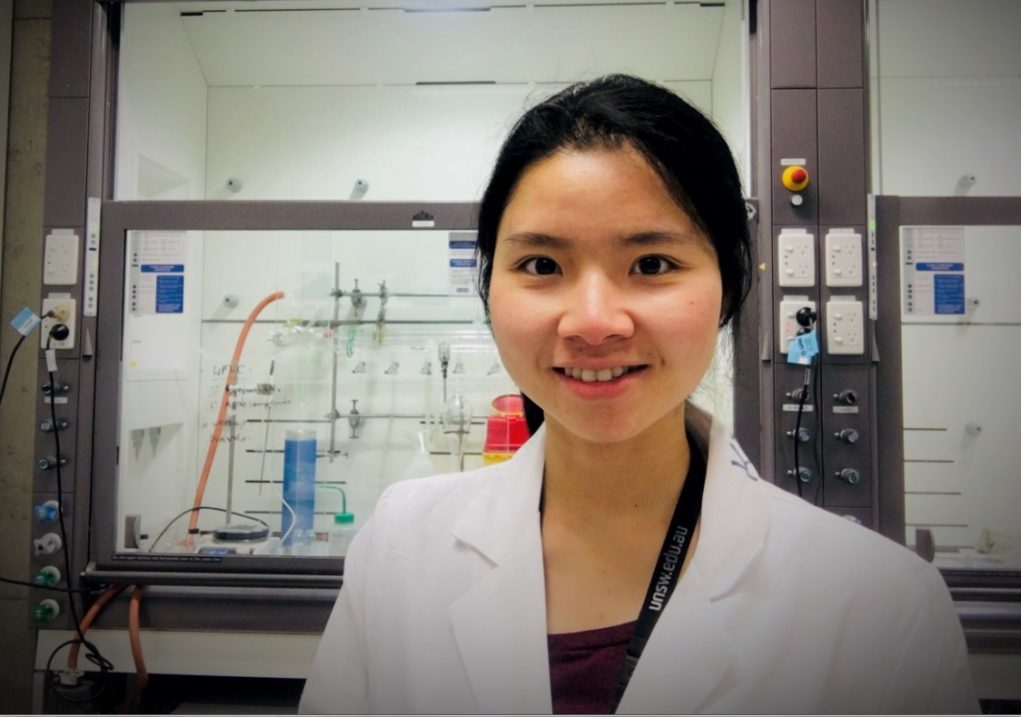
Congratulations to our runner up, Kristel Cahyadi Tjandra, third year PhD Candidate at CBNS: ARC Centre of Excellence in Convergent Bio-Nano Science and Technology, University of New South Wales under the supervision of A/Prof. Pall Thordarson. Given the interdisciplinary nature of her project, Kristel works with two diverse teams from the School of Chemistry (Thordarson Group) and Children’s Cancer Institute.

Kristel Tjandra UNSWKristel’s research is focused on the study of peptide-based drug delivery systems for targeted cancer treatment. Peptides are short chains of amino acids, often a part of a protein unit that has particular function inside the body. Her research objective is to design, synthesise and investigate the pharmacokinetics of peptide-based drug delivery systems, including the way they are taken up and react in the body, in order to develop drug-delivery systems that could target cancer cells in a specific manner.

Kristel plans to use her prize money to travel and attend the European Molecular Biology Lab (EMBL) Chemical Biology Workshop 2018 in Heidelberg, Germany, 29 Aug – 1 Sep 2018.

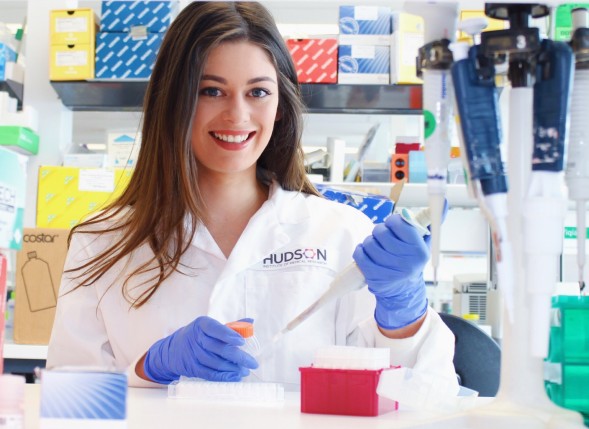
Congratulations to our runner up, Amy Wilson, from the Hudson Institute of Medical Research, Centre for Cancer Research, in Clayton, Victoria.

Amy Wilson Hudson InstituteAmy is a third year PhD Student in the Ovarian Cancer Biomarkers laboratory at the Hudson Institute of Medical Research, under joint supervision of Dr. Andrew Stephens and Prof. Magdalena Plebanksi.

Amy’s PhD research is focused on re-activating the immune system to more effectively treat ovarian cancers. Often, ovarian tumours are hidden from the immune system via secretion of certain proteins, and this can lead to chemo-resistance. Amy’s research involves the re-purposing of an already clinically approved drug in combination with current therapies in order to reinvigorate the anti-tumour immune response.

Amy plans to use the award to attend the Australasian Society for Biochemistry and Molecular Biology ComBio 2018 conference being held in Sydney from 23-26 September 2018.

For more information or to stay informed of other upcoming promotions please ‘Like us” on Facebook or contact us.

Looking for the perfect analytics instrument for YOUR next big discovery?

Speak with the ATA Scientific team today to get expert advice on the right instruments for your research

Request free consultation

ATA Scientific - Aerosol Measurement Techniques

Introduction to Aerosol Measurement Techniques and Applications

Over the past few decades, it has become increasingly important to actively measure and control aerosol use. While the application of aerosols remains critical to the function of a wide range of industries, including manufacturing and agriculture, there’s also increasing social concern regarding the impact that aerosols have in regards to air pollution, atmospheric science, nanotechnology, chemical manufacturing, medicine, and pharmaceuticals.

If you are going to work with aerosols, it’s important to understand how to measure them.

How aerosols are measured

There are two different categories in which aerosols are generally measured; there are ensemble measurements and single particle measurements. As the name suggests, single particle measurements are, simply, the measurement of the properties of individual droplets of the aerosol in question. Ensemble measurements, meanwhile, take the entire aerosol dispersion, and then average out the properties of all the droplets – as droplets will vary slightly in properties, this is a more reliable way to get a general reading on the use of aerosols in application (since aerosols are not applied one droplet at a time).

Single particle measurements are the more accurate and provide a more in-depth analysis of the aerosol’s mass and heat transport kinetics. Furthermore, this form of study will produce a better understanding of the thermodynamic equilibrium state of the aerosol.

Where aerosols are measured

There are also two different locations where aerosols can be measured. On the one hand, there are laboratory measurements, in which the aerosol will be measured in an idealised environment in order to look at the behaviour and properties of the aerosol in isolation. Field measurements, meanwhile, focus on the behaviour and properties of the aerosol in the natural environment. These measurements generally focus on establishing an estimate of the droplet concentration and chemical composition.

Finally, all of this comes together when scientists look to make modelling studies, which, as the name suggests, look to build a model and quantify the impact that the aerosol will have on the atmosphere, as well as the local and global effects of its use.

Why does all this matter?

Aerosols are a health risk in great enough quantities, and so in the interest of risk assessment, it’s important to be able to read and understand the size distribution of aerosols. When a particle is inhaled by a person, particles of different sizes and diameters will end up in different parts of the respiratory system. When particles get small enough to be nanoscale, they can penetrate the air blood barriers in the lungs and, from there, wind up in places such as the brain, heart, and liver. Naturally, this can have serious health implications.

As a result, organisations and governments that consider the importance of the health of those working in and around places where aerosols can be found need to understand the particles, and from there the potential risk they pose to the human body.

Benefits of measuring droplet sizes

In addition to the health benefits of properly measuring aerosol droplet sizes, as outlined above, such innovations can also be used for a host of other benefits. For example, researchers can use the techniques for measuring aerosol droplets to develop more effective approaches to orally inhaled and nasal drug products. The technology even has applications in fields such as automotive, where measuring the droplet size observed during the rapid firing of automotive fuel injector systems can produce data that can improve combustion efficiency.

Tools to measure droplet sizes

There are tools that have been developed that can help researchers determine the safety of a spray particle. For example, the Malvern Spraytec utilises laser diffraction technology to measure the size of the droplets and particles in an aerosol substance as they pass through the laser.

This information is then collected as data and analysed to calculate a precise size of the droplets. The machine is so precise that it can take readings of aerosol (including sprays, aerosols, droplets, inhalers, nebulisers) particle sizes from 0.1 to 900µm through to 2 to 2000µm, to an accuracy of better than 1%.

The information that is provided is done in real time (10,000 measurements every second), and the system comes with software that controls the measurement process and analyses the light scattering data. The software that powers the technology provides technical compliance to the requirements of 21 CFR Part 11 and ISO 13320:2009. These are international standards for laser diffraction measurements, meaning they are highly reliable and respected.

The chances are that if you’re working with aerosols, or, more broadly, gases, then the ability to measure droplet size will help you meet regulatory and health compliance requirements, as well as lead to improvements in the development and use of these tools. For more information on the Malvern Spraytec, contact ATA Scientific on (02) 9541 3500.

Looking for the perfect analytics instrument for YOUR next big discovery?

Speak with the ATA Scientific team today to get expert advice on the right instruments for your research

Request free consultation