All posts by atascientific

KINEXUS Rheometer offers more than just simple viscosity measurements

Fast, Accurate and Reproducible Shear and Axial Measurements.

Switching from a viscometer to a rheometer provides access to an extended range of test capabilities that can be used to accelerate and refine product formulations. Traditional barriers to fully exploiting the potential of rheology include not knowing which test to apply and how to interpret the resulting data. The Kinexus rheometer directly address these issues and makes detailed, informative rheological studies more accessible.
Contact us for a free trial using the Malvern Kinexus Rheometer today!

Read more about the Kinexus

What is Thixotropy & why is it important?
This webinar will provide an overview of thixotropy including its history, description and importance across various industries and applications.

Choose the right measurement system.

Discover the various geometries available for rotational rheometers and their advantages and disadvantages for different sample types and applications.

ATA SCIENTIFIC ENCOURAGEMENT AWARD – WINNERS POSTED
Congratulations to all our winners. The ATA Scientific Encouragement Award aims to provide young scientists with financial assistance to further their education and attend scientific meetings and conferences. Like us on Facebook to be informed of the next award.

Click here to read more about our winners


Looking for the perfect analytics instrument for YOUR next big discovery?

Speak with the ATA Scientific team today to get expert advice on the right instruments for your research

Request free consultation

atascientific - How to Measure Molecular Weight and Size Using Light Scattering Detectors

Biomolecular Science: How to Measure Molecular Weight and Size Using Light Scattering Detectors

Light scattering detectors measure the size and determine the structure molecules through a variety of techniques and equations. However, with so many systems of measuring available, it’s important to know how they work, and which instrument is most beneficial to your application.

What is molecular weight and size?

Molecular weight is the mass of an individual molecule, specifically the mass of material required to make a single mole. Molecular size relates to the physical size of an individual molecule. When used in light scattering techniques we refer to the ‘radius of gyration’ or Rg. Measurements are in nanometers.

Why is measuring molecule weight and size important?

In industrial application, there are a range of reasons for measuring the weight and size of molecules, such as:

  • improved performance in strength and durability of plastics and polymers
  • controlling the release rate and degradation of polymers used in medicine delivery
  • improving mouth-feel of polysaccharides in food products

For both consumer industries and industrial design and manufacturing, knowing the molecular size and weight of materials can have a profound affect on the design and manufacturing of new and existing products.

How is light scattering related to molecular size and weight

The equation that describes this relationship is called the Rayleigh equation. In basic terms, it tells us how the intensity and angle of scattered light is related to the size and weight of a molecule.

Molecules that are larger in size or have a higher molecular weight will scatter more light than lighter or smaller molecules. Furthermore, there is a linear relationship with the intensity of the light scattered and the increase in molecular weight, but a non-linear relationship to the size of a molecule.

Therefore, mathematically speaking, if we know all the other aspects of the Rayleigh equation, we can measure scattered light intensity to calculate a sample’s molecular weight.

How does static light scattering work?

Static light scattering (SLS) measures the intensity of scattered light in an environment where other variables are already known to measure the size and weight of a sample of molecules.

Chromatography systems

Using a chromatography system with static light scattering greatly reduces the number of issues that come about when purifying and preparing samples. SLS measurements can be made in a cuvette or in a Gel-permeation chromatography (GPC) system also known as Size-exclusion chromatography (SEC).

In SEC/GPC molecules are separated according to their size or hydrodynamic radius as they enter and exit the pores of a porous gel packing matrix in the column. In addition to separation, GPC/ SEC systems can be coupled to multiple detectors (Ultraviolet absorbance detector (UV-Vis), Refractive index detector (RI), Viscometer and Light scattering) delivering a complete set of data for each sample.

In a standard GPC / SEC system you’ll find the following process:

  1. The sample passes through the degasser and pump into the injection loop, or
    1. an autosampler places samples directly into the injection loop.
  2. Molecule samples are separated in the columns and oven.
  3. A light scattering detector measures absolute molecular weight.
  4. A refractive index or UV detector collects further data and measures concentration.
  5. A viscometer measures the intrinsic viscosity (IV) to investigate molecular structure and branching.

Understanding angular dependance

For higher sized molecules, the intensity of light scatter will vary with the measurement angle. Accounting for this is called ‘angular dependence’, and is crucial for measuring larger molecules. Remember ‘radius of gyration’, this plays a keep part in determining which sized molecules are affected by angular dependence. Generally speaking:

  • Molecules with an Rg < ≈15 nm are isotropic and have little to no angular dependence.
  • Molecules with an Rg > ≈15 nm are anisotropic and the intensity of light which they scatter will vary at different angles.

As molecular size increases with respect to the laser wavelength, the scattered photons no longer scatter independently, but start to interfere with each other. Different types of light scattering devices attempt to overcome this in different ways.

Types of Static Light Scattering instruments

SLS instrumentation comes in 4 major variants:

  • Right angle light scattering (RALS)
  • Low-angle light scattering (LALS)
  • RALS / LALS hybrid detectors
  • Multi-angle light scattering (MALS)

Right angle light scattering (RALS)

RALS instruments are the simplest device for measuring light scattering, but they can be amongst the best.

Advantages of a RALS system

  • Straightforward without complicated optics.
  • Have great signal to noise ratio and sensitivity. As the light passing through the liquid interface is at 90 degrees, the change by flare or noise in the refractive index is minimised.
  • Great for measuring the molecular weight of proteins.
  • Has small flow cells.

Disadvantages of a RALS system

  • For an accurate 90 degree measurement, the assumption is that scattering is isotropic (i.e. equal at all angles). For molecules large enough to display angular dependence, this is not true. So RALS can’t accurately measure the molecular weight of molecules with an Rg > ≈15nm.

Since proteins are almost always smaller than 15nm radius, RALS detectors are excellent for measuring protein molecular weight.

Low angle light scattering

LALS instruments measure the scattering of light as close as possible to 0 degrees, giving a closer measurement of the intensity of the light scattering. To be considered a LALS system, the measurement must be below 10 degrees, with most LALS devices settling on 7 degree measurements. LALS are typically used for larger molecules and anisotropic scattering from synthetic and natural polymers

Advantages of LALS systems

  • By measuring close to the axis of the Zimm plot, LALS provide high accuracy on molecular weight.
  • Can measure the molecular weight of any molecule.
  • Accommodating a single measurement angle, only a small flow cell is required.

Disadvantages of a LALS system

  • LALS systems are traditionally more prone to noise from large particles scattering in a forward direction. Modern techniques reduce this noise.
  • Since scattered light is being measured at a single angle, a LALS system can’t measure Rg.
  • Due to the proximity of the scattered light and laser light, production of LALS are more difficult than RALS.

RALS / LALS hybrids

Hybrid RALS / LALS detectors combine the effectiveness of both right angle light scattering and low angle light scattering to produce highly complementary results.

  • RALS measurements provide accuracy on weak scattering smaller molecules.
  • LALS measurements give better readings on larger anisotropic scattering molecules.

Combining the readings of RALS and LALS systems into a single computation can be used to estimate the radius of gyration.

Multi-angle light scattering

MALS instruments measure light scattering at multiple points to increase accuracy in data for molecules with an Rg > ≈15 nm. Different angles can be removed to reduce noise, however complexity in design means increased costs as well as lower signal to noise readings.

Advantages of MALS systems

  • Ideal for measuring large, anisotropic light scattering molecules.
  • Provides insight into angular dependance.
  • Can also be used on isotropic, smaller molecules that don’t exhibit angular dependence.
  • Some angles can be removed from readings if they produce too much noise.

Disadvantages of MALS systems

  • Produce more noise than other systems.
  • Require a larger flow cell resulting in increased peak broadening.
  • Expensive to produce.
  • It is not always clear which extrapolation fit and model gives the right answer, as exact shape and structure of the molecule are not known.

Which system is right for you?

Light scattering systems have a number of beneficial uses across many industries, however choosing the right instrument can be difficult. Talk to ATA Scientific about which GPC / SEC system is right for your needs, and find out how our instruments can help you gain further insights for your research today.


Looking for the perfect analytics instrument for YOUR next big discovery?

Speak with the ATA Scientific team today to get expert advice on the right instruments for your research

Request free consultation

WINNERS OF OUR ENCOURAGEMENT AWARD, AUGUST 2017

ATA Scientific would like to thank all those that participated in our August 2017 Encouragement Award promotion. 

The topic of our latest competition was focused on Malware such as Petya and WannaCry and ways we can protect our computer systems by taking lessons from the way nature deals with threats. Three entries were selected to receive our award– first prize at $1500 and 2 runners up at $600 each.

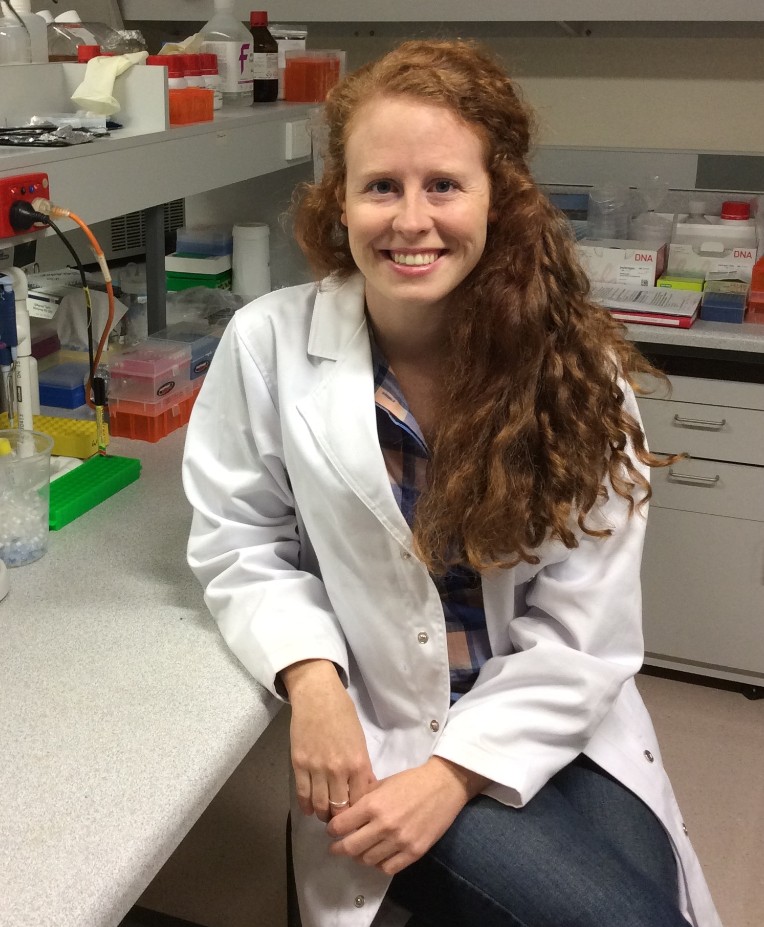
Congratulations to our first prize winner of $1500, Samuel Pinches,  third year PhD student in the department of Chemical and Biomolecular Engineering at the University of Melbourne, in the Ceramics and Minerals Processing Group with Professor George Franks.

“I have a real passion for learning how things are made, and I have found a keen interest in understanding the relationship between the unique properties of a material, the processes that can shape and change the material, and the applications that this combination can enable”. 

Samuel’s research is focused on examining a new process to potentially enable the production of complex shaped ceramics, more efficiently. The group is examining a modified freeze-casting process in order to produce dense near-net shaped ceramic parts. The goal of this new process is to reduce the time and cost per part, in order to improve the feasibility of mass producing complex-shaped ceramic parts. Previous work has identified that this process produces parts with major flaws, so Samuel’s work has focused on studying each step of the process, in order to develop a clearer understanding of what is occurring, and to identify the cause of defects observed in samples. By working to apply the knowledge that is gained, the group can minimise the flaws and optimise the product quality, as well as identify any limitations that remain for using this process in real world applications.

“I am grateful for the support from ATA Scientific with this award, and this award will enable me to attend the 1st Asia-Pacific International Conference on Additive Manufacturing (APICAM2017) in December this year.  I would encourage current students to keep an eye out for future awards!”

Congratulations to our runner up, Atma Maria Ivancevic, a Postdoctoral Researcher at The University of Adelaide, Robinson Research Institute, Adelaide Medical School, Neurogenetics.  Atma works under the supervision of Professor Jozef Gecz, at The University of Adelaide.

Atma’s current project is focused on investigating structural variations in the human genome (e.g. deletions, duplications, mobile element insertions) and understanding their role in neurological disorders such as epilepsy and cerebral palsy. Using whole genome sequencing data and massively parallel computing infrastructure, Atma’s work is focused on design and optimizing pipelines to identify pathogenic variants. Ultimately, this will help to define the diverse spectrum of genomic rearrangements that contributes to disease risk in the human population.

“As an early career researcher, one of the biggest challenges is getting noticed at an international level in the scientific community”.

Atma plans to use her award to attend a prestigious international conference (e.g. 2018 Human Genome Meeting in Japan) that will allow her to network with the best genomics labs in the world. This is particularly important considering Atma’s immediate career plans are to move overseas for a postdoc next year in 2018.

Congratulations to our runner up, Dr Kendall Corbin, Post Doctoral Research Fellow in the College of Medicine and Public Health at Flinders University, South Australia. Kendall works in the Medical Biotechnology Department headed by Professor Chris Franco.

Her research focuses on finding novel and innovative ways to utilize agro-industrial waste and low-value marine resources for biofuel or medical applications. Interest in capitalising on these underutilised resources is attributed to the unique biological properties of extractable carbohydrates and bioactive compounds. Furthermore, the use of these residues is considered to be more socially and environmentally responsible than using edible portions of food crops.

One limitation that currently undermines the practicality of using waste biomass sources is the complexity of the material (more specifically the plant cell wall). Plant-based bioresources consists of a heterogeneous matrix of carbohydrates, polyphenol polymers and proteins that are difficult to separate into discrete, usable components without using toxic chemicals or high-energy inputs. To circumvent these limitations my research explores the potential to incorporate green chemistry approaches as a sustainable alternative for biomass processing. Kendall hopes that this innovative multi-facet approach will set the scene for further advancements in the field and ultimately our ability to convert trash (agricultural waste) into treasure (high-value products).

Kendall plans to use this award to attend one of the workshops/conferences organised by the European Molecular Biology Laboratory (EMBL). One of the key conferences of interest is Microfluidics 2018: New Technologies and Applications in Biology, Biochemistry and Single-Cell Analysis (Heidelberg, Germany).

We would like to thank all those that participated. The next Encouragement Award will be posted on our website soon.

For more information or to stay informed of other upcoming promotions please ‘Like us” on Facebook or contact us.


Looking for the perfect analytics instrument for YOUR next big discovery?

Speak with the ATA Scientific team today to get expert advice on the right instruments for your research

Request free consultation

NEW Phenom Generation 5 – The serious alternative to floor model SEMs

Advanced features of the Generation 5 usher in capabilities previously only seen in floor model SEM systems, at a fraction of the expense!

The new 5th generation Phenom Pro and ProX series of desktop SEMs by Phenom-World marks ten years of SEM innovation. The new generation features enhanced imaging, 20 percent resolution improvement, new software to significantly widen application range and an optional secondary electron detector (SED). The Phenom maintains its hallmark ease of use with the NeverLost navigation and integrated automated stage. Applications include materials science, manufacturing, electronics, earth science, life sciences, education, and more.

Take a look at the new 5th Generation Phenom SEM today!

Desktop SEM electron sources: why CeB6 is the right choice

When looking for a scanning electron microscope (SEM), the electron source is one of the most important parts of the system. This article takes a closer look Tungsten and CeB6 electron sources.

Take the Quiz: Guess the SEM image

Can you recognise samples that are magnified more than a thousand times using an SEM? Guess these 10 SEM images and discover whether you are a SEM Starter, Star or Superstar.

WIN $1500 – ENCOURAGEMENT AWARD COMPETITION

Enter now for your chance to win. First prize is for $1500 and there are two runner up awards at $600 each. The ATA Scientific Encouragement Award aims to provide young scientists with financial assistance to further their education and attend scientific meetings and conferences.

Entries close 31 Aug 2017.

Like us on Facebook to be informed of the winners.


Looking for the perfect analytics instrument for YOUR next big discovery?

Speak with the ATA Scientific team today to get expert advice on the right instruments for your research

Request free consultation

atascientific - Particle Size Analysers and How They Work

Particle Size Analysers and How They Work

Particle size analysis employs a number of different methods to measure the size distribution of particles in the nano, micron and millimetre range. The best type of analysis will depend on the type of particle you need to measure. Often, several kinds of analysis are used to gather a more complete picture. Read on to find out which types of analysis would best suit your needs.

Laser diffraction analysis

Laser diffraction is a popular method for measuring particle size distribution, particularly between the 0.01 to 3500 micron range.

How laser diffraction works

A beam of light of fixed wavelength, projected at a group of dispersed particles will scatter light at different angles depending on their size. Larger particles will scatter light at smaller angles while smaller particles will scatter light at larger angles. A series of detectors measure the intensity of light scattered by the particles and their size is determined using an optical model of light behaviour.

Mie theory

In laser diffraction analysis Mie theory is used to calculate the distribution of particle size. Mie theory requires knowledge of both:

  • The refractive index (RI) in relation to both the dispersant and the sample being measured, and,
  • The imaginary refractive index – the absorption or transparency of the sample (which accounts for chemical properties and surface roughness).

Most laser diffraction instruments will have built-in databases where the dispersant measurement can be obtained. For samples where the optical properties are not known and cannot be measured, an iterative approach can be taken on an educated guess. Alternatively, the Fraunhofer model provides a simpler approach by assuming the RI difference between the particle and and the medium is infinite. However this approximation breaks down as particle size decreases below 50 micrometres and as particles become more transparent. Mie theory therefore remains the prefered method in the ISO standard ISO13320 as it covers a wider measurement range.

Benefits of laser diffraction

Benefits of laser diffraction include:

  • Can measure a wide dynamic range – Laser diffraction can measure from submicron to millimetre lengths.
  • Rapid results – Can produce results in less than a minute.
  • Easily repeatable – Laser diffraction technique produces a large sample with each measurement, and requires very little configuration to repeat sampling.
  • High throughput – Hundreds of measurements can be taken per day.
  • Instant feedback – Results are produced quickly.
  • Easy to calibrate – Standard reference materials provide ease of calibration covered by ISO13320:2009.

Laser diffraction instruments

The typical laser diffraction particle size analyser usually comprises of three key elements:

  • The Optical Bench – Once the sample is dispersed, the Optical Bench contains the measurement area, where a beam of laser light illuminates the particles, and a series of detectors to measure the scattered light pattern.
  • Sample Dispersion Units – Ensure the correct concentration of sample is dispersed to the measurement area. They come in two varieties, wet and dry.
  • Laser Diffraction Software – Software is required to control the instrument, analyse the data and calculate the size distribution of the particles in each sample.

Dynamic Light Scattering (DLS)

DLS is an established technique for the analysis of particles in the submicron region down to below 1 nanometre. It is commonly used to measure particles suspended in liquids such as:

  • proteins
  • polymers
  • micelles
  • carbohydrates
  • nanoparticles
  • emulsions
  • colloidal dispersions

Dynamic Light Scattering encapsulates two similar techniques of particle size analysis:

  • Photon Correlation Spectroscopy (PCS)
  • Quasi-Elastic Light Scattering (QELS)

How DLS works

Thermally induced collisions between suspended particles and the molecules of the solvent cause the particles in suspension to undergo random movement known as Brownian motion.

DLS measures the speed at which particles are diffusing due to Brownian motion and relates this to the size of particles. When a sample is illuminated by a laser, the intensity of scattered light fluctuates at a rate dependant on the particle size. Smaller particles within the solvent are displaced further and at a more rapid pace. By analysing the intensity of these fluctuations, the velocity of Brownian motion or the translational diffusion coefficient can be used to determine particle size using the Stokes-Einstein equation.

Advantages of DLS

Due to it’s capacity for measuring submicron sized particles the advantages of DLS over other forms of particle size analysis include:

  • non-invasive (the complete sample can be recovered)
  • quick analysis times with speedy throughput
  • analysis can be completed at high or low concentrations using a small sample size
  • ideal for measuring a broad range of biomaterial and nano particles

Dynamic Light Scattering instruments

DLS instrumentation requires a laser light and a lense to converge the light. The process typically works as follows:

  1. The laser is focused on the sample through the lense.
  2. Light is scattered by the particles.
  3. A detector, typically placed at 90 degrees (or 173 degrees, depending on the particular Zetasizer Advance model) to the light source, collects the scattered light.
  4. Intensity fluctuations of the scattered light are converted into electrical pulses.
  5. These pulses feed into a digital correlator which generates a particle size based on an autocorrelation function.

The Zetasizer Advance series of instruments detect the scattering information at 173 degrees. This is known as backscatter detection and has significantly better performance than systems using 90 degree scattering optics. Some advantages include:

  • Reduced multiple scattering effects enabling higher concentrations to be measured
  • Contaminants such as dust effects are reduced
  • Variable measurement positioning can reduce flaring effects and allow small particles and dilute or highly concentrated samples to be measured.

Automated imaging

Used predominantly for particles between 1 micron and several millimetres in size, automated imaging captures high resolution images of up to thousands of particles to create statistically representative distributions of particles. Automated imaging is often used in conjunction with other particle size analysis techniques like laser diffraction for a deeper understanding of the distribution or to validate previous findings.

Benefits of automated imaging

Benefits of automated imaging include:

  • the ability to detect agglomerates, oversized particles or contaminants
  • measurement of shape difference
  • measurement of size of non-spherical particles

Automated imaging techniques

There are three key techniques in automated imaging to measure particle size distribution.

Scanning Electron Microscopy (SEM)

SEM imaging takes place in a vacuum chamber therefore samples need to be fixed and dried thoroughly to prevent unwanted interactions between the electron beam and any atmospheric molecules. Using an SEM, a focused beam of electrons scans the surface to produce images of a sample. As the electrons in the beam interact with the atoms in the sample, the microscope gathers information about the sample’s surface topography and composition. Once an SEM image is acquired, automated analysis and classification software enables the particles to be further processed and characterised.

The Phenom SEM range offers superfast, easy-to-use, high-resolution imaging including elemental composition analysis of large samples.

Optical microscopy

Optical microscopy illuminates a sample using visible light to provide a magnified image. Sample dispersion is key for correctly measuring particle size through imaging. The goal is spacial separation of particles in the field of view and will depend on whether the imaging technique is dynamic or static. Dynamic imaging uses a flow cell through which the sample is passed during a measurement. In static imaging the dispersed sample is placed on a flat surface like a microscope slide. In both cases, the use of automated dispersion prevents inconsistencies and improves procedural efficiency.

ATA Scientific offers a range of high quality image analysers including the Malvern Morphologi 4 ID particle image analyser, which has been designed for automated high-resolution particle size analysis between 0.5 and 1000 microns. It automatically targets individual particles and provides the size, shape, and chemical identification of each.

The right analytical tools for you

Need help finding the right particle size analytical equipment for your application? Contact ATA Scientific today to for a free consultation and discover the right instruments for your project.

Looking for the perfect analytics instrument for YOUR next big discovery?

Speak with the ATA Scientific team today to get expert advice on the right instruments for your research

Request free consultation

It’s time for faster more accurate biomolecular characterisation

Differential Scanning Calorimetry (DSC) is a powerful analytical tool for characterising the thermal stability of proteins and other biomolecules. The technique measures enthalpy and transition midpoint (Tm) to provide insights into the mechanisms of protein folding and unfolding. It can be used to predict shelf-life of biomolecular products, compare biosimilar versus innovator molecules, to develop purification strategies, and to rank the affinities of ligands to their protein targets in small molecule drug discovery programs.

MicroCal PEAQ-DSC systems are simple to use, requiring little assay development, and no labelling or immobilisation. Take a look at the new Malvern MicroCal PEAQ-DSC today!

Watch this Video and discover the advantages of using MicroCal Differential Scanning Calorimetry (DSC) for protein stability characterisation in comparison with other analysis techniques.

Watch this recorded webinar
A number of technologies were employed to understand and predict the stability of vaccine formulations including Differential Scanning Calorimetry (DSC).

OTHER USEFUL COMPLEMENTARY TECHNIQUES INCLUDE:

Nanoparticle Tracking Analysis

Dynamic Light Scattering

Circular Dichroism Spectroscopy

ATA SCIENTIFIC AWARD – WINNERS POSTED

Congratulations to all our winners. The ATA Scientific Encouragement Award aims to provide young scientists with financial assistance to further their education and attend scientific meetings and conferences. First prize is for $1500 and there are two runner up awards at $600 each.
Like us on Facebook to be informed of the next award.


Looking for the perfect analytics instrument for YOUR next big discovery?

Speak with the ATA Scientific team today to get expert advice on the right instruments for your research

Request free consultation

Winners of our Encouragement Award, May 2017

ATA Scientific would like to thank all those that participated in our May 2017 Encouragement Award. 

Three entries were selected to receive our award– first prize at $1500 and 2 runners up at $600 each.

Congratulations to our first prize winner, Magdalena Kohut, PhD student at the University of Auckland studying Organic Synthetic Chemistry.

“My present research interests lie in small molecule synthesis with potential medicinally important activity. Throughout my future career as a broad goal I am determined to carry on searching for applications of science to benefit society, at the same time addressing the challenges of sustainable research and development. I seek a future as part of the bio-economy and am keen to learn about how academic research is commercialised”

Magdalena will use the award to help fund her travel and participation as one of 100 Leaders of Tomorrow at the Gap Summit conference at Georgetown University on 6th – 10th June 2017. The Gap Summit is a prestigious invite-only conference from which Magdalena was selected from a large pool of applicants. It will allow her contribute to discussions regarding the current global bio-economy and the grand challenges within the biotech industry. Listening to and meeting biotech CEOs, policy makers and research pioneers will give her a new perspective to her current and future work.

To read more about this conference visit http://dev.globalbiotechrevolution.com/events/gapsummit-2017/


Congratulations to our runner up, Hasintha Wijesekara
, a PhD student to the Global Centre for Environmental Remediation (GCER), The University of Newcastle. Hasintha works under the supervision of Professor Nanthi Bolan, Professor of Environmental Chemistry at The University of Newcastle.

His research is focused on understanding the biogeochemical mechanisms of biosolids application on carbon sequestration in soils. He uses biosolids which is treated sewage sludge to limit greenhouse gas emission and enhance soil carbon sequestration.

Hasintha plans to use his award to attend the International Annual Meeting for the Soil Science Society of America, “Managing Global Resources for a Secure Future”, Tampa Convention Center, Tampa, Florida, USA, October 22-25, 2017.


Congratulations to our runner up, Rahd Youakim,
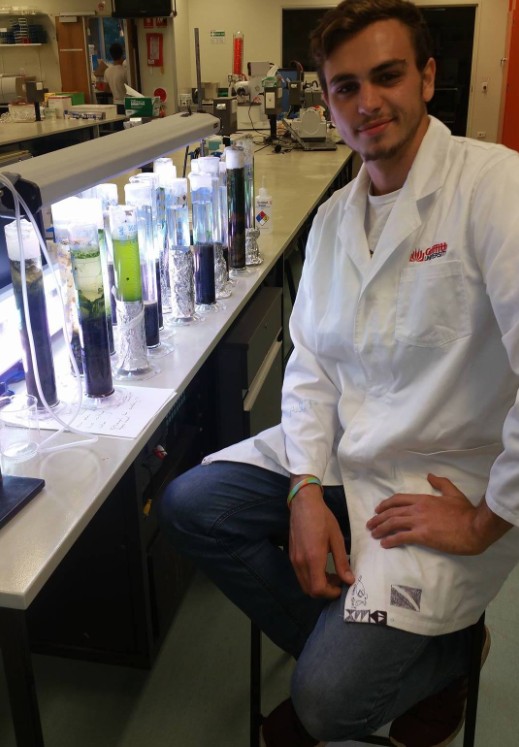
 an aspiring second year student, Studying Marine science and majoring in Coastal Physical sciences at Griffith University.

“A big dream yes I know! But my mum once told me that we are always destined to be the best person we can be and showed me the way to inner-happiness is to give more than you take”.

Rahd plans to use his award to contribute to his tuition costs which will assist with achieving his career goals and implementing his ideas in the future. He plans to purchase an aquaculture/ aquaponics system which will consist of a 2ft, 3ft and 4ft fish tank with filters, heaters etc. With the skills and knowledge gained from his studies, he would like to conduct his own experiments so that he can one day present his findings for every type of environment and implement these to ensure the best sustainable practices.

We would like to thank all those that participated. The next Encouragement Award will be posted on our website soon.

For more information or to stay informed of other upcoming promotions please ‘Like us” on Facebook or contact us.


Looking for the perfect analytics instrument for YOUR next big discovery?

Speak with the ATA Scientific team today to get expert advice on the right instruments for your research

Request free consultation

ATA-Scientific---Tensiometers-and-How-They-Work500px

Tensiometers and How They Work to Measure Surface Tension

Tensiometers like the Attension Sigma and Theta tensiometers measure the surface tension of fluids to give you a better understanding of their interfacial behaviour.

How exactly does a tensiometer measure surface tension? There are a number of different tensiometer types, each with their own unique method of calculating surface tension.

What is a tensiometer?

At its most basic, a tensiometer is an instrument used to measure the surface tension of liquids. This can include:

  • liquid coatings
  • liquid adhesives
  • liquid lacquers

In practical application, they help scientists predict and develop the behaviour of a whole host of products, including cleaning agents industrial parts cleaning, electroplating processes, measure soil moisture, and the wettability, absorption and density of powders.

What is surface tension?

Surface tension is the tendency for fluid surfaces to display an elastic behaviour, acquiring the smallest surface area possible. Think about a pool of liquid on a bench.

  • Why does it tend to bunch together?
  • Why does the exterior of the mass look like it is bonded by an elastic band?

To answer these questions we must first understand how fluid molecules behave.

The relationship between water and air

At the interface of two molecular masses – fluids, solids or gasses – a lot can happen. The molecules at the interface tend to be more attracted towards their own molecules. This is what gives fluids “shape”. It’s also why they tend to be the smallest size possible, as the molecules at the interface are pulled ‘inwards’.

This is easy to demonstrate with water, a liquid with a higher surface tension than most other fluids. Where water meets air, water molecules have a higher attraction to each other than the air molecules. We see water molecules at the interface of air and water resistant to air and attracted to other water molecules.

Cohesion and adhesion

The two principles at play in all interfacial tensions are cohesion and adhesion:

  • Cohesion: Referring to the attraction of molecules of the same kind, this force is responsible for giving fluids their shape. In a mass of water molecules, all molecules are attracted equally to neighbouring water molecules. At the edge or surface, where there are no fluid molecules on one side, there is more ‘pull’ towards the centre, resulting in an inward pressure.
  • Adhesion: Adhesion is a similar principle, but defines how molecules from different substances attract to one another, such as the adhesion of water molecules to a glass test tube leading to an upward turning meniscus and contributing to capillary action .

The end result is that there is an inward force on the fluid surface that causes the water to behave as if their was an invisible elastic membrane around the water. This imbalance of tensions is where we get the name “interfacial tension”.

What is interfacial tension?

Interfacial tension means practically the same thing as surface tension. The main difference is that surface tension refers to a single liquid surface, where interfacial tension refers to the interface of two immiscible liquids, solids or gases.

Tip: Surface tension is a subset of interfacial tension where the force exerted by the second surface is zero.

Types of tensiometers

Now that you understand surface tension, let’s look at how you can measure it using a tensiometer.

There are several different types of tensiometer, each measuring the surface tension of a fluid in a distinct way. The best method to use depends on the volume, viscosity, and availability of the fluid.

Contact Angle Goniometer/ tensiometer

The Goniometer is most commonly used to measure the surface tension and interfacial tension of expensive liquids, as it only requires a few drops to get a reading.

Using either the pendant or sessile drop methods, drops of fluid are captured by the Charge-Coupled Device camera, a device used to capture the movement of electrical charge.

The digital image of the charge is processed through computer software using the Young-Laplace equation, which describes the capillary pressure difference at the interface between two fluids.

Wilhelmy Plate tensiometer

The simplest and most accurate form of tensiometer, the Wilhelmy Plate only requires a plate to make contact with a liquid to provide a result. The plate is usually made from filter paper, glass or platinum. In truth, it doesn’t matter what the plate is made from as long as the material can be ‘wetted’ by the fluid. The measurement is of the force exerted on the plate. Because the plate doesn’t move, it is generally a highly accurate measurement.

Du Noüy-Padday method tensiometer

The Du Noüy-Padday method works by dipping a rod in and out of a pool of liquid and measuring the precise force used to extract the rod from the fluid. The main advantages of this method are that it is repeatable and accurate even on fluids with high viscosity. The main drawback is that it requires a pool of fluid so it might not be realistic for expensive liquids.

Du Noüy Ring tensiometer

Similar to the above method, only the Du Noüy Ring tensiometer uses a platinum ring which is submersed and held horizontally in liquid and then pulled out. The ring has to be almost exactly perfect. Any scratches or damage to the ring material can alter the ring significantly.

Bubble pressure tensiometer

By pumping a gas stream into a capillary that is immersed in fluid, this tensiometer is able to measure surface tension through the behaviour expected by bubbles forming at the tip of the capillary.

Recommended tensiometers

The Attension Sigma and Theta tensioners are among the most accurate devices for measuring static surface tension and interfacial tension of fluids.

Using the tensiometry principal, the Attension range tensiometers measure:

  • surface and interfacial tension
  • critical micelle concentration
  • dynamic contact angle
  • surface free energy
  • powder wettability
  • density

Take your research and development to the next level with accurate measuring tools at cost-effective price points. Contact ATA Scientific to find out more about our preferred scientific instruments today.


Looking for the perfect analytics instrument for YOUR next big discovery?

Speak with the ATA Scientific team today to get expert advice on the right instruments for your research

Request free consultation

Register for this Webinar: Cement composition, structure and fineness

Thanks for your interest in the cement composition, structure and fineness Webinar.

Please bear with us as we give you a brief explanation as to why Malvern Instruments and PANalytical are combining to present this webinar.

As one of our subscribers you may know that Malvern Instruments are specialists in particle size analysis and that their Mastersizer analysers are used in many cement laboratories.  PANalytical XRF and XRD systems are also widely use in Cement Labs. Previously these were separate sister companies. However they have recently been merged in order to combine their resources and provide customers with a more comprehensive range of instruments and services.

Locally, ATA Scientific (representing Malvern) and PANalytical are likewise cooperating to provide you with the best assistance and ongoing service.

Register now


Looking for the perfect analytics instrument for YOUR next big discovery?

Speak with the ATA Scientific team today to get expert advice on the right instruments for your research

Request free consultation

The Ins and Outs of Chromatography

What is chromatography?

Chromatography is a scientific process in separation science, the part of chemistry concerned with the separation of compounds and mixtures. Generally speaking the two significant categories are preparative and analytical.

Analytical chromatography uses smaller sample sizes and the primary objective of separating compounds is to identify their components. A good example is in a lab environment where you are searching for toxins or pollutants in a sample.

Meanwhile preparative work uses large quantities with the aim of removing impurities from samples to prepare them for use outside the lab. Pharmaceutical production is a good example of preparative chromatography.

Who discovered chromatography?

A Russian botanist named Mikhail Tswett unearthed Chromatography in the early 1900s after discovering that ground-up plant material extracts produced different coloured solutions based on the type of solvent used in the extraction process.

Tswett’s breakthrough came through experiments involving plant extracts poured through a glass tube packed with calcium carbonate powder. Tswett discovered that as the liquid extract passed through the powdered calcium carbonate bands of colour appeared in the tube. Individual compounds had separated from each other as the powder (a solid) interacted with the liquid flowing through the tube.

The word itself is derived from the Greek words for colour (chroma) and writing (graphe).

What is chromatography used for?

Chromatography is actually one of the most valuable processes available to chemists. It can be used for anything from crime scene investigation to identifying biological matter. Advanced chromatography is used in bomb detection. It can be used to determine how much pesticide is on your fruit skin, or if an athlete has been using a banned substance. Here are some other uses for this this important chemical process:

  • Determining the’ heat’ of a chilli pepper.
  • Ebola Immunisation – while no immunisation yet exists, chromatography was important in creating Zmapp, and continues to play a role in the investigation of this disease.
  • Quality assurance – alcohol brands like Jaegermeister use chromatography to ensure sugar levels remain consistent throughout the product cycle.
  • Meat testing – remember Britain’s horsemeat scandal back in 2013? Chromatography was instrumental in determining fact from fiction after other tests proved inconclusive.

What can’t chromatography do?

Like all experiments, there are limits to what chromatography can tell you. You won’t find the secret recipe to Coca Cola through chromatography. Just like the components of wine don’t tell you the process by which it was made, recipes and mixtures go through a number of preparation processes that can’t be reverse engineered through chromatography with a high degree of accuracy. You can find out the basic components of a cola soft drink, but not necessarily a specific recipe. In the case of coca cola, caramelisation of the sugars plays a huge part. Still, chromatography is one of the best methods for discovering compound components within the separation sciences.

Essentials of chromatography

At its most basic the chromatographic process consists of a stationary phase and mobile phase (also called an eluent). As in the early example above, the stationary phase consists of a solid, thick liquid or bonded coating that remains fixed in place. The eluent moves through the stationary phase, and is comprised of either a liquid or gas.

A sample compound (called an analyte) is then added to the process. As the eluent travels through the stationary phase the analyte should react with both the mobile and stationary phases.

Chromatography is essentially like a running race. The chemical compounds are the runners and stationary phase is what separates the runners. At the beginning, they’re all at the starting line. As they cross (elute) the finish line one after the other we can identify each runner (chemical).

Why should the analyte react with both phases in a chromatographic process?

If the analyte doesn’t react with the stationary phase then it will travel at the same speed as the eluent and leave the process (elute) at the same rate as the eluent. Similarly, if the sample doesn’t react with the mobile phase, it will remain in the process with the stationary phase. Neither is ideal.

Different types of chromatography

While the type of chromatography described above most closely resembles liquid column chromatography, there are actually many ways to attempt a chromatographic process.

Paper chromatography

You might remember this experiment from school science class – what happens to ink on paper when you make it damp? The process is reasonably simple, take some filter paper and place a spot of ink close to the edge. Hang the paper with the blotted side facing down. Now dip in a solvent like alcohol or water.

The solvent will travel up the paper via capillary action and dissolve the ink. The solvent is the mobile phase, the paper the stationary phase. The ink is the analyte and as it travels up the paper with the mobile phase it separates into different components. Depending on the type of ink these components might be visible. If they are not, you can use a developing fluid to bringing out the separate colours.

Column chromatography

Column chromatography uses a vertical glass cylinder for the stationary phase, packed with silica gel or some other highly absorbent solid. Mobile phase (eluent) is pumped at high pressure into the stationary phase.

Thin-film chromatography is a type of column chromatography where the column is a film of plastic, metal or glass.

Gas chromatography

Gas chromatography uses gases for the mobile phase. Components of the sample are heated and vaporised in the machine, with a neutral gas used for the eluent (hydrogen or helium). As each component elutes, it pases an electronic detector which identifies it and prints a peak on the chart. Gas Chromatography is sometimes called vapor-phase chromatography (VPC).

Gel permeation chromatography (GPC) or Size exclusion chromatography (SEC)

ATA Scientific offers  a number of GPC/SEC  systems for determining molecular weight, where multi-detection is the key method of measurement. Multi detection is capable of collecting more comprehensive data in a single experiment by using a series of detectors which includes light scattering, RI and UV detectors, and viscometer detectors.

The OMNISEC Advanced Multi Detection SEC/GPC is a gel permeation and size exclusion chromatography system designed for discovering characteristics of natural and synthetic polymers, copolymers, proteins, nanoparticles and other macromolecules. It combines Refractive index, UV VIS absorbance, light scattering and viscometer detectors to measure concentration, molecular weight and intrinsic viscosity with unparalleled accuracy. The OMNISEC can also be connected to any third party GPC/SEC system to enhance existing capabilities.

The Viscotek SEC MALS 20 Detector is a multi angle light scattering detector used for measuring absolute molecular weight and  oligomeric state of proteins, independent of retention times. The Viscotek SEC MALS 20 offers up to 20 angles and a unique vertical flow cell to ensure optimum performance and accuracy.

Find out more

As you can see chromatography can be extremely valuable and is used for a variety of applications.

You can find out more about ATA Scientific’s Chromatography Products here.

To view a recent webinar, visit this site here.