


 02 9541 3500
The Key Considerations For Developing Lnps As Drug Delivery Vehicles.
Lipid Nanoparticles (LNPs) continue to grow in popularity as they enable the efficient delivery of therapeutic payloads such as RNA. LNPs as delivery vectors hold immense promise for nucleic acid-based gene therapy, oncology, and vaccine development. Although LNPs can be manufactured using cell free production processes with the potential for rapid scaling, they can be analytically challenging to develop and manufacture due to their complex structure.
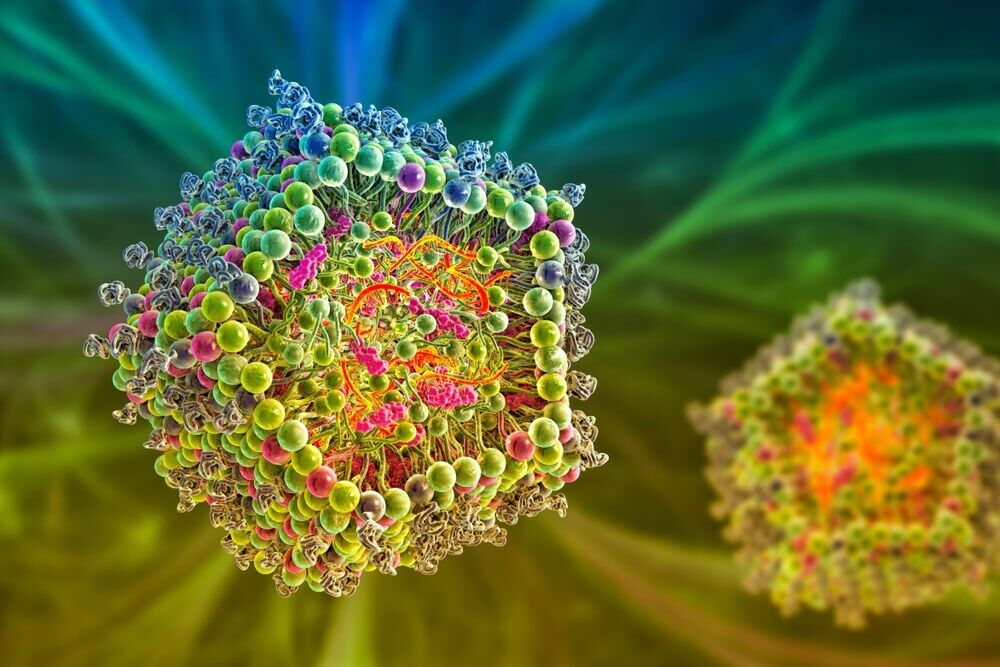
LNPs are generally composed of four main components: cholesterol, phospholipids, a PEG-conjugated lipid, and a synthetic ionizable cationic lipid. LNPs, generally with a diameter of 50–100 nm, are formed by controlled nanoprecipitation of the lipids around the RNA molecules. The existing models state that the ionisable lipid first surrounds the RNA by electrostatic interaction with the anionic phosphate groups. The cholesterol and phospholipids contribute as structural components, before the PEGylated lipid inserts into the LNP surface, with the PEG group facing outwards, providing a hydration layer, and making the LNPs less prone to early elimination by the immune system, increasing circulation time in the blood stream.
The PEG monolayer is an essential component of most mRNA-LNP formulations. PEG provides multiple vital functions, such as minimising protein absorption and extending circulation times to help the vector protect and deliver nucleic acid therapeutic cargo to the desired target. However, the PEG monolayer can reduce the electrostatic repulsive forces between particles, resulting in lower colloidal stability of the drug product.
Measuring a range of critical quality attributes (CQAs) is key in determining stability and can provide insight for optimising the drug design and manufacturing process. Key attributes include Size, Polydispersity, Concentration, Surface charge, Payload information and Thermal stability.
Analytical tools to optimise Lipid-based nanoparticles (LNPs) development
The exponential use of LNPs in research has highlighted the need to better understand and control the stability of LNPs from formulation development to manufacturing. The size, size distribution or polydispersity index (PDI) are indicators of the success of the particle formation. Empty LNPs are typically found to be unstable over time and always show higher PDI values. In addition, the final size and size distribution will depend on the success of encapsulation of the payload like which influenced by the buffer composition used during and after the formulation process. This indicates that the understanding and control of internal structure and micro/nano environment inside the LNPs is very important to be able to understand and optimise the stability of such a delivery platform.
Established Light scattering techniques, such as Dynamic Light Scattering (DLS) and Nanoparticle Tracking Analysis (NTA), are commonly used to measure LNP physicochemical properties, including particle size, particle size distribution, PDI and particle concentration, which relate to LNP CQAs.
LNP Size
LNP size is a critical attribute for the function of LNP therapies, as it can determine tissue penetration and efficacy. It can also help you identify potential instability in your sample (typically displayed as aggregation or a change in particle size) due to external stresses, such as storage conditions or processing steps. There are 3 analytical techniques that can be used to efficiently and reliably measure LNP size – namely single angle Dynamic Light Scattering (DLS), Multi-Angle Dynamic Light Scattering (MADLS), and nanoparticle tracking analysis (NTA). These techniques cover a wide particle size range.
Dynamic Light Scattering (DLS) – Zetasizer series
DLS is a non-invasive, well established technique for measuring size and size distribution of particles in a liquid. While DLS is not a high-resolution technique, it is accurate, reproducible, fast, and requires no method development.
In DLS, a laser light illuminates particles in a dispersion which scatter light in all directions. Measuring the scattering intensity fluctuations gives the velocity of the Brownian motion, which is then used to calculate the particle size using the Stokes-Einstein relationship. The Malvern Zetasizer can detect particles ranging from 10s of µm to below a 1 nm, meaning it can measure even the smallest mRNA-LNPs (which typically range from ~50–150 nm). DLS offers a wide concentration range and is used as a rapid screen for sample degradation or aggregation which is particularly useful for LNPs as they often occur in very high concentrations. In addition DLS is non destructive and requires low sample volumes (~20 µl) meaning you can preserve your precious samples and re-use them in other assays.
However, larger aggregates tend to scatter more light in the forward angle, meaning that it can be difficult to detect the presence of LNP aggregates. For this reason, the scattering angle used should always quoted.
Multi-Angle Dynamic Light Scattering (MADLS) – Zetasizer series
While DLS works by measuring samples at a single angle, Multi-angle dynamic light scattering (MADLS) measures samples at multiple angles, offering improved resolution as well as angle independent particle size distribution. MADLS provides a more accurate representation of the different populations present in the sample, and a higher resolution size determination of multi-modal samples. It can also consistently detect low numbers of larger aggregates (which are inherently harder to detect with single angle DLS, as discussed above).
Like DLS, MADLS can detect even the smallest LNPs, with a detectable size range of 10 μm to 1nm and below. Using a known refractive index is a key consideration for using MADLS as is the absorption of the sample material and dispersant. Since RNA can change the refractive index of a sample, users need to know if samples contain RNA or not. To do this, a RiboGreen assay can be used to calculate the refractive index or it can calculated from compositional analysis data using Size Exclusion Chromatography (SEC).
LNP Concentration
Nanoparticle Tracking Analysis (NTA) – NanoSight Pro
Using the properties of both light scattering and Brownian motion Nanoparticle tracking analysis (NTA) can determine nanoparticle size distribution of samples in liquid suspension. For this technique, a laser beam illuminates particles in liquid suspension which are loaded into a sample chamber. Particles in the path of the beam scatter the light, which is then collected by a microscope and viewed with a digital camera. The camera captures a video of the individual particles moving under Brownian motion, with software analysing many particles individually and simultaneously, particle-by-particle. By using the Stokes Einstein equation, NTA software then calculates the hydrodynamic diameters of the particles. NTA does not require any knowledge about the material such as RI or absorbance. This orthogonal technique described by the ISO standard 19430 tracks particles in real time to provide size, concentration and fluorescence data. NTA is a higher resolution technique when compared to DLS and MADLS and can be particularly useful when analysing polydisperse LNP samples and to detect subtle changes in the characteristics of LNP populations. NTA uses very low volumes (1 μl, before dilution) which is fully recoverable and requires little sample preparation, however is not suitable for particles below 50nm.
In addition to size and concentration, NTA also provides scatter intensity, which resolves adjacent populations of particles and differentiates materials of sufficiently-differing refractive indices. This unique ability potentially allows the user to probe whether nanoscale drug delivery structures such as LNPs vary in their contents, i.e. empty LNPs may have a lower refractive index (light scattering power) than those loaded with a higher refractive index material. This would allow them to be differentiated even though they may be of very similar sizes.
In addition, fluorescence detection capability allows differentiation of suitably labeled particles from complex backgrounds.
Size Exclusion Chromatography (SEC) – OMNISEC Multidetector system
To achieve more in-depth characterisation of the different size populations in a polydisperse LNP sample, it is essential to use a separation technique like size exclusion chromatography (SEC) coupled with multiple in-line detectors. Using SEC ahead of size measurement improves the resolution of the identified populations. Multi-detection SEC works by separating molecules based on their hydrodynamic radius as they pass through a chromatography column, with larger components being eluted first followed by smaller ones. After the separation step, one or more advanced detectors (such as refractive index, UV/Vis-PDA, and right-angle light scattering and multi-angle light scattering, RALS and MALS) can be used to gather further information about the sample including size, molecular weight, and aggregation profile.
SEC with in-line detectors is a key tool for LNP payload quantification
Understanding the therapeutic payload of LNP vectors particularly how much of the payload has been incorporated into the LNP is critical to ensuring patients receive the correct therapeutic dose. Traditional analytical methods for quantifying LNP vector payload can be labour intensive, require complex method development, where protocols are not easily transferable between different LNP formulations. SEC with multiple detectors has emerged as a key approach for LNP quantification.
By observing the sample’s concentration using both the RI and UV/Vis-PDA detectors, equations can determine the concentration of two components within a single sample (in this case, LNPs and the genetic payload). By comparing the concentrations of the two components, you can then obtain the weight fraction (%) of the LNP payload. SEC-LS has several benefits and does not require the dedicated reagents needed in traditional methods.
LNP Charge
Electrophoretic Light Scattering (ELS) –Zetasizer series
Optimal surface charge (or zeta potential) is a key attribute in the development of LNP therapies where the value depends on the target tissue. Zeta potential will influence an LNP’s solubility and interaction with cellular membranes. Knowledge of the surface charge can therefore help predict the in vivo fate and activity of an LNP therapy.
Zeta potential can offer insight into its surface chemistry (and any modifications it may undergo). Several factors can influence the measured zeta-potential including pH, ionic strength and the concentration of other components in the solution (such as additives, coagulants, and surfactants).
Electrophoretic Light Scattering (ELS) is a key tool that can be used to measure the zeta potential of LNP samples. ELS involves electrophoresis where a dispersion is introduced into a cell containing two electrodes, and an electrical field is applied across them. Particles with a net charge (or zeta potential) migrate towards the oppositely charged electrode with a velocity (known as the mobility) related to their zeta-potential. A laser is passed through the bottom of the cell, with the charged particles producing scattered light that is frequency shifted in proportion to their velocity. By detecting the frequency shifts, we can then calculate the zeta potential.
When it comes to LNP samples, ELS is most often used to validate the apparent surface charge to evaluate formulations for stability and predicted uptake efficiency in target tissues. However, LNP therapies which are prepared in physiological buffers, are high conductivity which pose significant challenges. High-conductivity samples interfere with accurate zeta potential measurements in a number of ways including heating effects, electrode polarisation, electrode degradation, and sample degradation. Also, simply applying a voltage across a high-conductivity sample can cause it to aggregate. The challenges of high-conductivity samples can be prevented with the diffusion barrier method.
When working with high-conductivity samples the diffusion barrier separates the particles in a sample from the electrodes by inserting a small ‘plug’ or aliquot (~20–100 ul) of sample into a folded capillary cell that already contains the same buffer that the sample is prepared in. This isolates the sample from the electrodes. Since the sample is not directly in contact with the electrodes, sample integrity is maintained, and electrode degradation is minimised. Furthermore, it reduces the amount of sample required for zeta potential measurements.
LNP Structure
Beyond size and size distribution, structure and structural stability are the key attributes of a biotherapeutic drug determining its ability to consistently deliver and maintain the desired function throughout the manufacturing process, administration, and longer-term storage. This makes analysis of structure and stability a critical task combining multiple assays which together inform the selection of candidates and formulation conditions. While size and polydispersity measurements conducted over time or as a function of temperature can inform on stability of particles in RNA-LNP samples, they need to be complemented by direct assessment of the intra-particle structure and structural stability of RNA-LNP. RNA is the crucial structural component for the assembly of lipids in LNPs, so structure and structural stability are key properties ensuring desired function and safety of LNP formulations and their cargo. Slight changes in formulation or storage conditions can affect the way the components interact and assemble into an RNA-LNP complex.
Thermal stability using Differential scanning calorimetry (DSC) – MicroCal PEAQ DSC
Temperature change is a common stress factor for LNP-based therapies throughout production, storage, and application. By monitoring thermal stability profiles, the intrinsic structural stability of RNA-LNPs can be assessed. This can help track changes between batches and stress conditions, to alert users to any changes in higher order structure.
Differential scanning calorimetry (DSC) is a valuable and well-established tool for monitoring the thermal stability and thermally induced transitions of biomolecules and biomolecular assemblies including lipid-based delivery vectors and nucleic acids. DSC works by measuring the heat change associated with a sample’s structural transitions when heated at a constant rate.
Consisting of two cells — a reference cell with buffer, and a sample cell with the sample solution, the DSC system is designed to maintain the two cells at the same temperature as they are heated. The absorption of heat that occurs when a molecule undergoes a structural changes causes a temperature difference (ΔT) between the cells, resulting in a thermal gradient across the Peltier units (or thermoelectric modules). This leads to a voltage, which is converted into power and is used to control the Peltier to return ΔT to 0°C. The output of a DSC measurement is a thermogram which provides multiple parameters for describing the thermally induced transitions of samples.
- Tm (thermal transition midpoint), also known as the melting temperature of the sample. The higher the Tm, the more stable the sample. Shifts in Tm can indicate structural heterogeneity of the sample, or degradation.
- Tonset (thermal transition onset) is the onset of a thermal transition event. The lower the onset, the higher the occurrence of unfolded species at this sample condition, and the higher the probability of aggregate formation linked to the unfolded species. This information can help formulators understand the temperature ranges to avoid to maximise sample stability.
- T1/2 (the width of thermal transition at half-height): The T1/2 reflects the extent of cooperativity of the thermal transition. The narrower the transition, the more cooperative it is.
- Enthalpy change (ΔH) is the total energy spent in a thermal transition, and reflects the relative amount of native biomolecule in your sample.
- Higher order structure (HOS): The entire thermogram shape can give us a fingerprint of the molecule’s HOS and provide a stability profile of biomolecules during development.
- Reversibility: While not a feature of the thermogram itself, the reversibility of thermal transitions is another key aspect of structural transitions observed with DSC. Reversibility reveals the ability of biomolecules to re-adopt their native structure upon cooling. Low reversibility is characteristic of unfolding events accompanied by aggregation and/or chemical degradation.
Therefore DSC results can give us insights into the functional efficiency, stability and degradation, modifications, and half-life of the nucleic acids and oligonucleotides in question, helping formulators to design and select optimal RNA variants for therapies.
MMS is A Game Changer in RNA-Ligand Analysis – Aurora series
Microfluidic Modulation Spectroscopy (MMS) and provides ultra-sensitive, ultra-precise structural analysis of a wide range of biomolecules like proteins, peptides, antibodies, mRNA, ADCs, and AAVs. It measures structural changes due to buffer/pH/formulation, stress, point mutations, binding partners, and storage conditions. When compared to CD or FTIR, MMS can detect structural change 20x faster and with 30x greater sensitivity. MMS combines a high-power Quantum Cascade Laser with real-time buffer referencing. This provides the power to analyse both low and high-concentration samples, in formulation buffer without excipient interference, to detect small but critical structural changes.
The Benefits of Aurora MMS
What sets this system apart is its ability to perform these analyses with minimal sample requirements (50µL of sample), high sensitivity and exceptional accuracy – all within an automated space saving unit that is simple to operate. The Aurora MMS system provides a wealth of information about the protein’s secondary structure, allowing users to gain insights into its folding, stability, and conformation. Proteins can be analysed at concentrations as low as 0.2 mg/mL to >200 mg/ml, a capability that was once considered impossible with traditional methods.
LNP: In summary
LNP size is a critical determinant of its ability to penetrate tissues to deliver payloads, and can indicate sample instability. DLS, MADLS, and NTA offer accurate and reliable ways to measure LNP size and PDI across a range of particle size ranges, and with different resolutions. Choosing the right tool depends on several considerations, including the size and polydispersity of LNP samples, sample concentration and available sample volume. MADLS, NTA, and SEC-LS provide valuable concentration measurements across a wide range and offer measurements orthogonal to mass-based techniques. The technique choice depends on the size of the LNPs, the amount of sample available (NTA can access lower concentrations), and resolution needed (MADLS offers a good quick, rough screen).
ATA Scientific offers a suite of robust, accurate, and highly reproducible biophysical techniques to help better characterise the critical quality attributes of LNPs — from size and polydispersity to surface charge and composition. These tools offer powerful, complementary approaches to track the development and manufacture of LNP-based therapies, delivering deeper insights while also offering opportunities to minimise sample use, save time, and reduce costs.
For more information please contact us.